



US Dollar Price Action Setups: USD/JPY, GBP/USD, EUR/USD, Gold, BTC
Weakness can be opportunity, particularly when a counter-trend move shows in a broader theme that remains in-place. Markets are still pricing in rate hikes for later this year and the below-expected CPI print earlier this morning produced a pullback in the US Dollar.
Share this:

US Dollar Price Action Setups:
- As discussed yesterday the bullish trend in both the USD and USD/JPY was in a difficult spot to chase.
- The below-expected CPI print out of the US has produced pullbacks in both markets, and the reaction from bulls here can be telling for broader trend resumption.
- For USD-weakness, GBP/USD looks more attractive, as discussed in the below video, and both Gold and Bitcoin are of interest for bigger picture themes to go along with USD scenarios.
US Dollar
The trend is fairly clear from both weekly and monthly charts as the bullish breakout in the Dollar has, so far, held higher-low support. At the time of the above webinar there was a support test going down at an important spot, and I went over this from a few different perspectives as to how and why it mattered. At this point, buyers are making a move, and from the daily chart, we can see yet another underside wick at support from prior resistance, keeping the door open for a push towards the highs.
US Dollar Daily Chart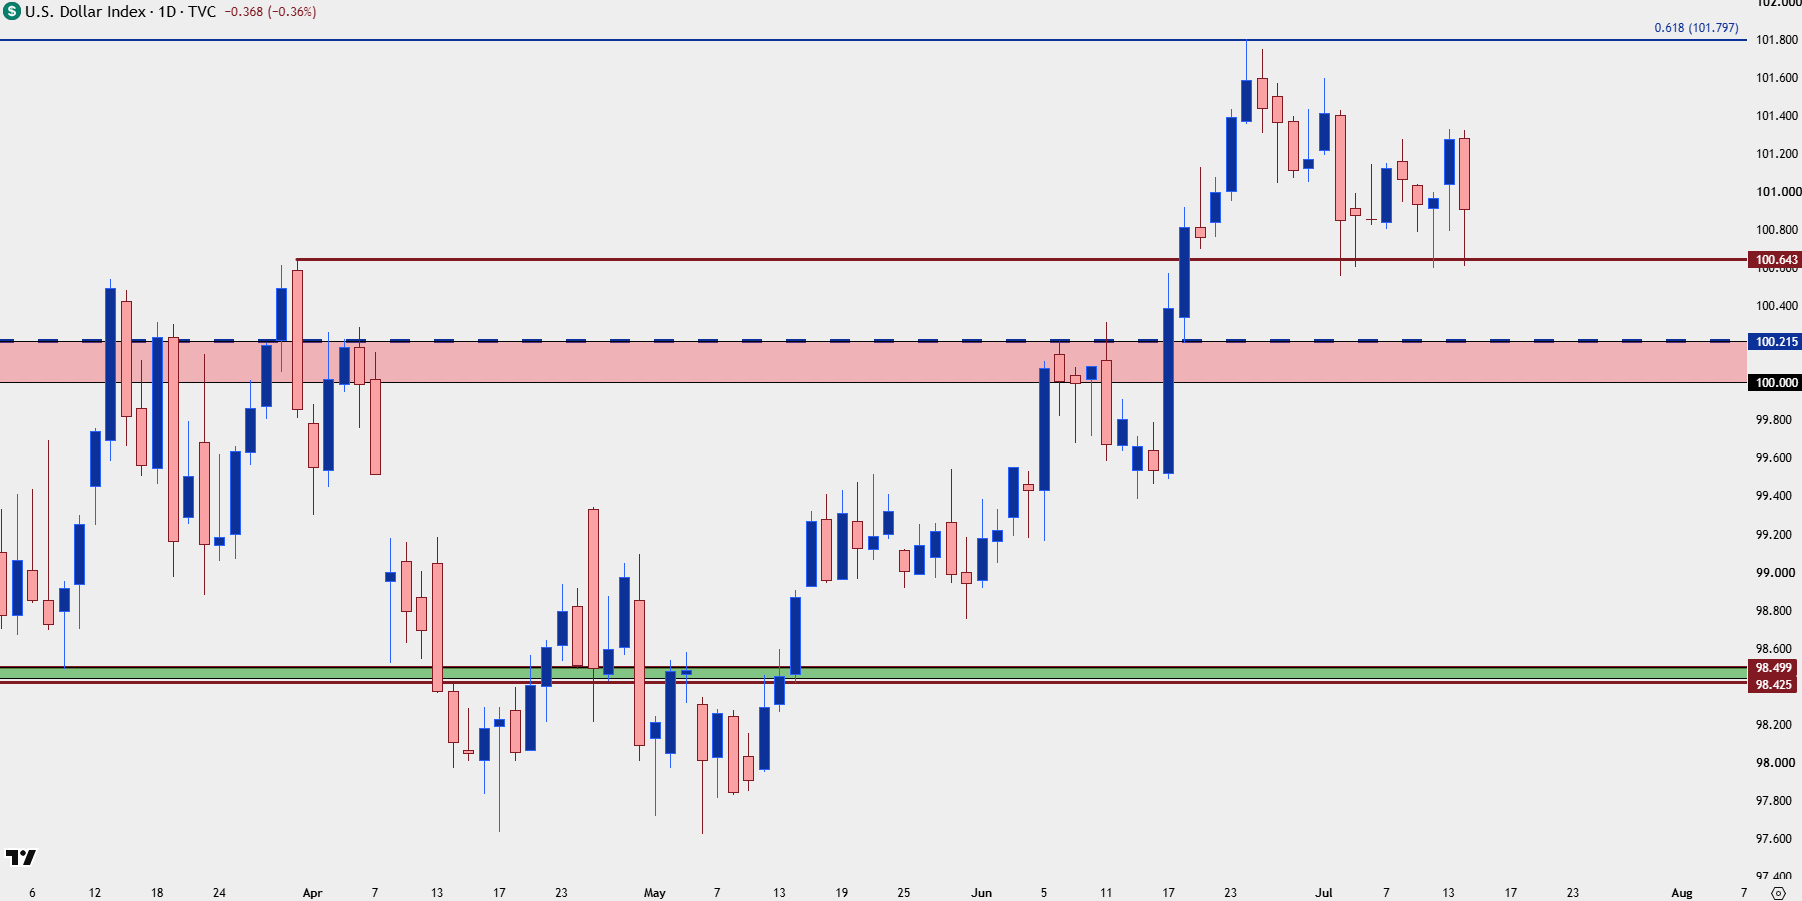
Chart prepared by James Stanley; data derived from Tradingview
USD/JPY
I looked at this theme in yesterday’s USD/JPY article and as was the case a few months ago, USD/JPY remains my favored bullish USD setup. The 165 handle has some historical importance and 163 is the big spot of resistance for now, but like the USD above, the below-expected CPI print produced an opportunity for bulls that, so far, have responded well to the 161.95 level.
The door remains open for a run at highs and possibly even a breakout.
USD/JPY Daily Chart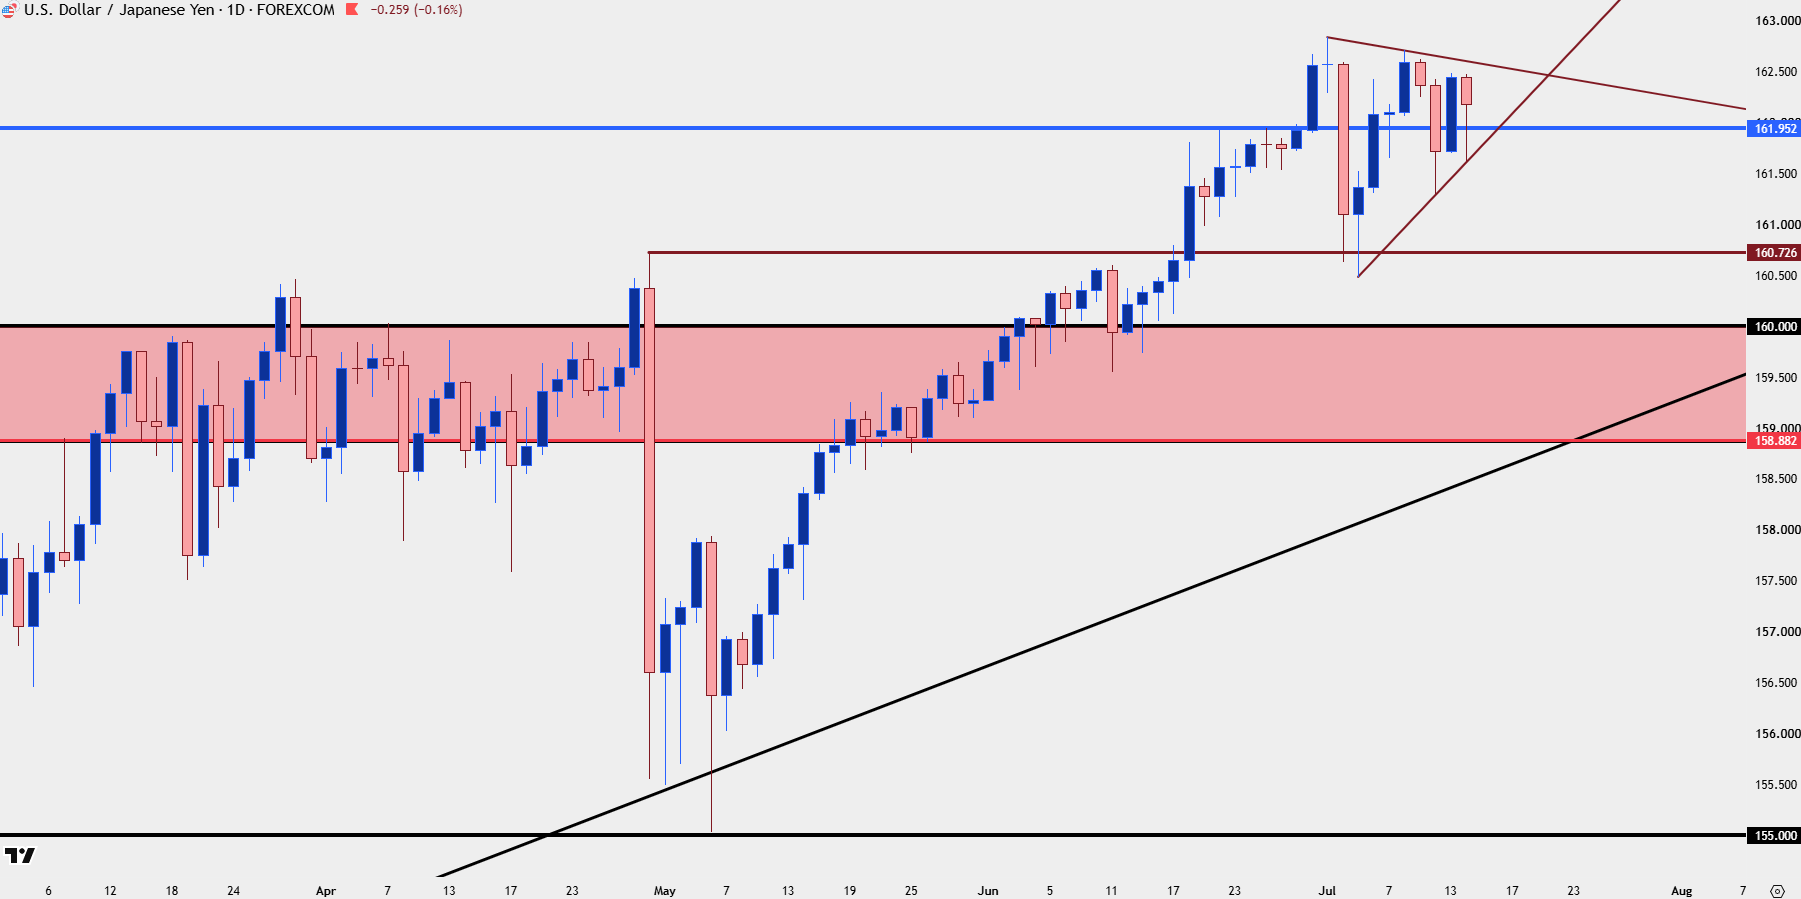
Chart prepared by James Stanley; data derived from Tradingview
GBP/USD
For USD-weakness scenarios, I still like Cable, which has held up fairly well over the past few weeks, all factors considered. It also comps nicely against EUR/USD which has broken down to a fresh lower-low.
With that said, if USD-strength remains aggressive even a brighter backdrop in GBP/USD may not be able to overcome a stronger slide, and price is already testing the ‘s1’ support level looked at in the webinar, with s2 and s3 just below.
GBP/USD Four-Hour Price Chart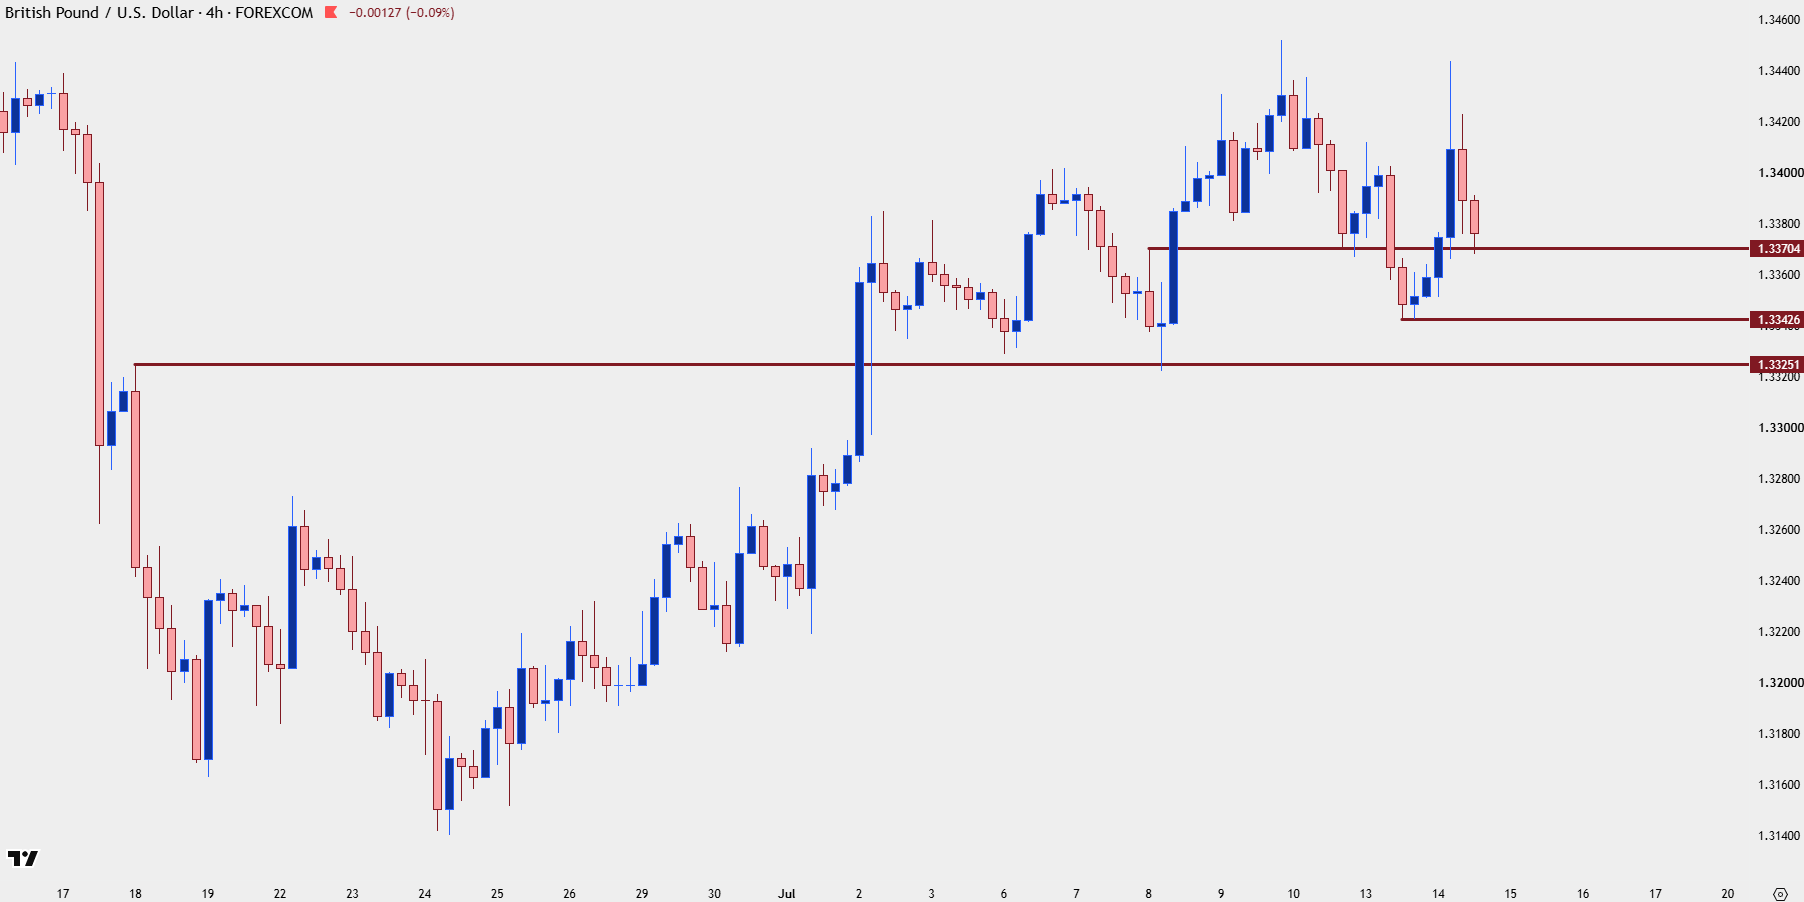
Chart prepared by James Stanley; data derived from Tradingview
EUR/USD
The Euro is an incredibly large part of the DXY basket at 57.6% and echoing the Dollar’s strength above, we have a bearish backdrop in EUR/USD, at he moment. That said, the move has so far been stalled for three weeks after a break to a fresh lower-low, so I’d be cautious of chasing at this point until greater evidence of bearish continuation appears. And for bullish USD backdrops that USD/JPY setup still carries more attraction, in my opinion.
In EUR/USD, there’s already been a few tests of prior support at 1.1469 so I’d want to look for a resistance reaction around 1.1500, at a minimum, before plotting for downside continuation. Above that, I’m tracking a zone from 1.1576 up to 1.1613 and then an ‘r3’ level around 1.1669.
EUR/USD Weekly Price Chart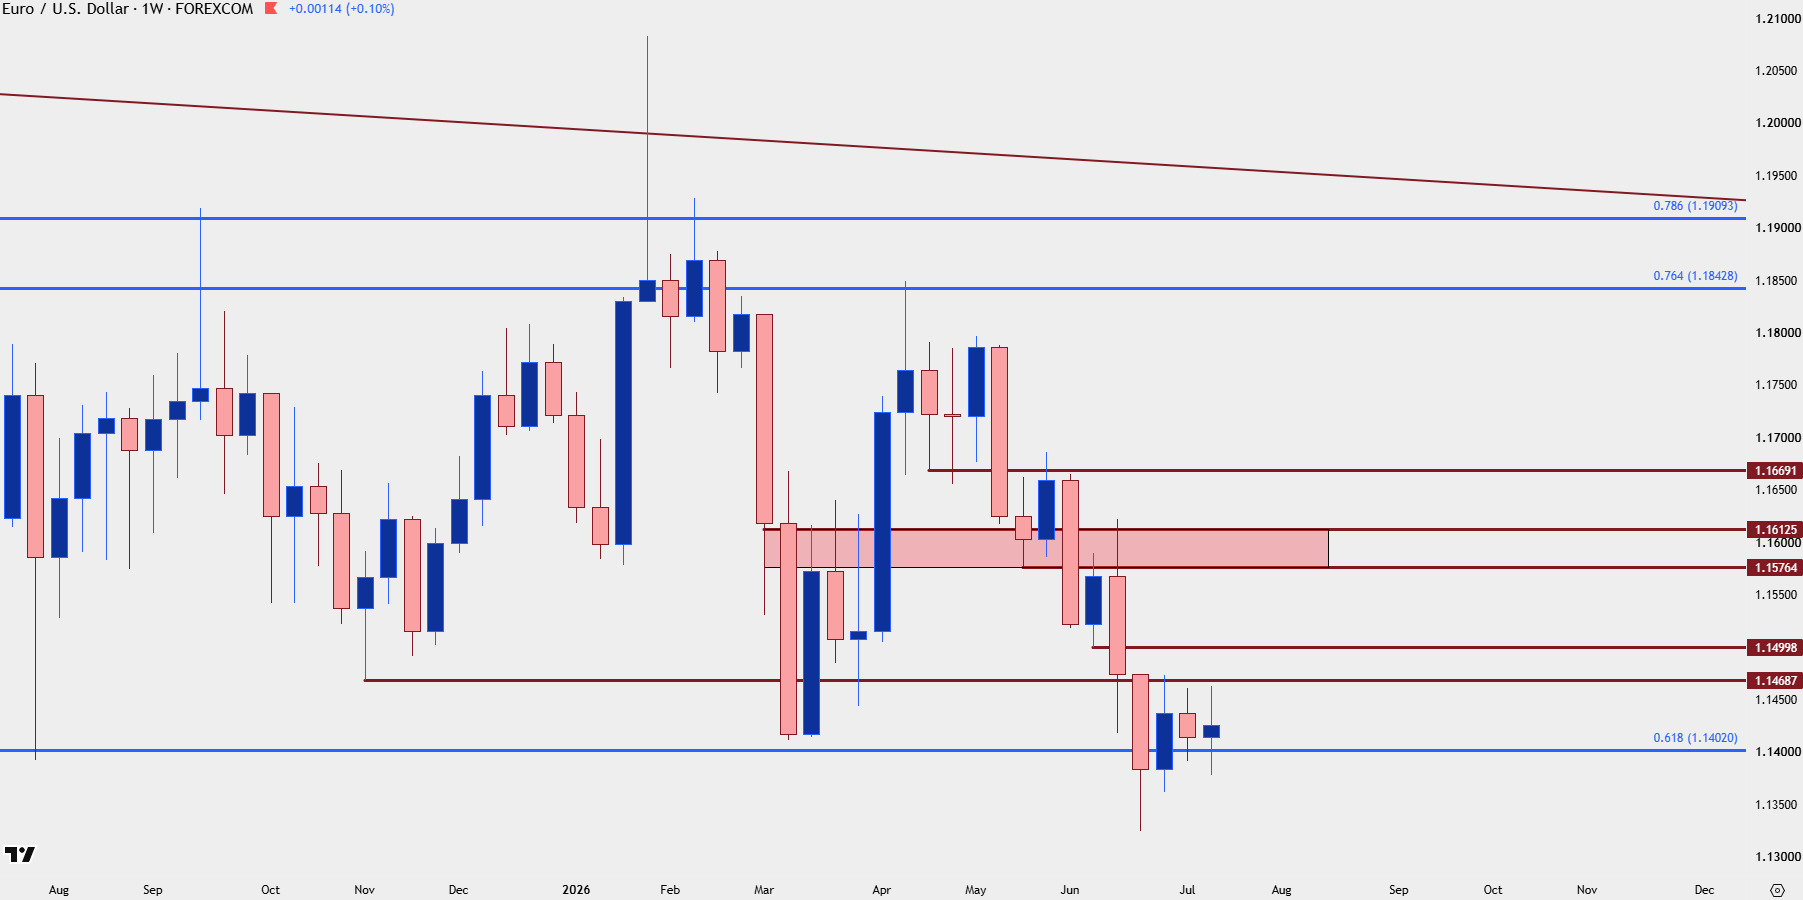
Chart prepared by James Stanley; data derived from Tradingview
Gold
Gold continues to flirt with a break of the 4k level which, so far, has been well supported. Sellers have remained persistent, however, helping to produce a descending triangle, and until buyers can push above 4200 there’s a case for further downside.
As shared in the webinar, I remain bullish on gold due to longer-term fundamentals and related expectations, but for now, the technical setup just is not there on the daily or weekly charts. Shorter-term, I did share how that could possibly change but at this point buyers have some work to do.
Gold Daily Price Chart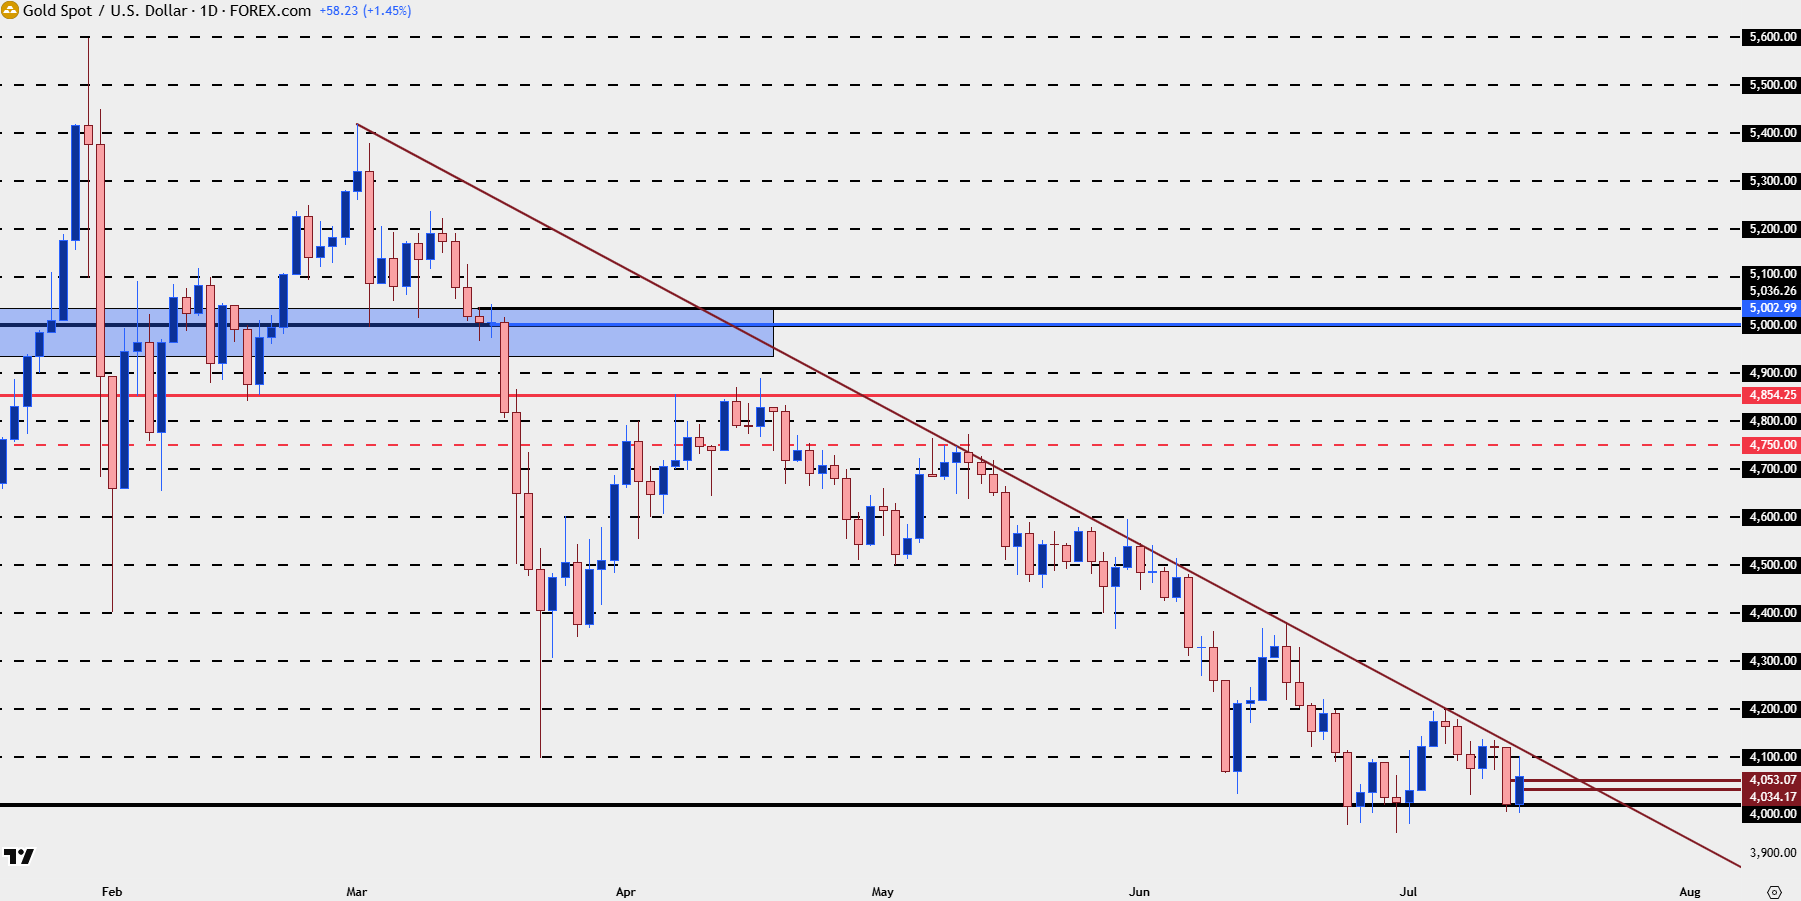
Chart prepared by James Stanley; data derived from Tradingview
Bitcoin
While gold outperformed BTC late last year and earlier this year, more recent dynamics have begun to shift as gold teeters at support while Bitcoin threatens a larger breakout. The 65k level remains a big line in the sand and a break above that opens the door for bigger picture trend resumption, although for buyers to really take away the trend they’re likely going to need some help from the US Dollar above.
But, for now, both BTC and USD are rallying after the CPI report so this certainly isn’t a situation where the Dollar must be weak for BTC to exhibit strength.
BTC/USD Daily Chart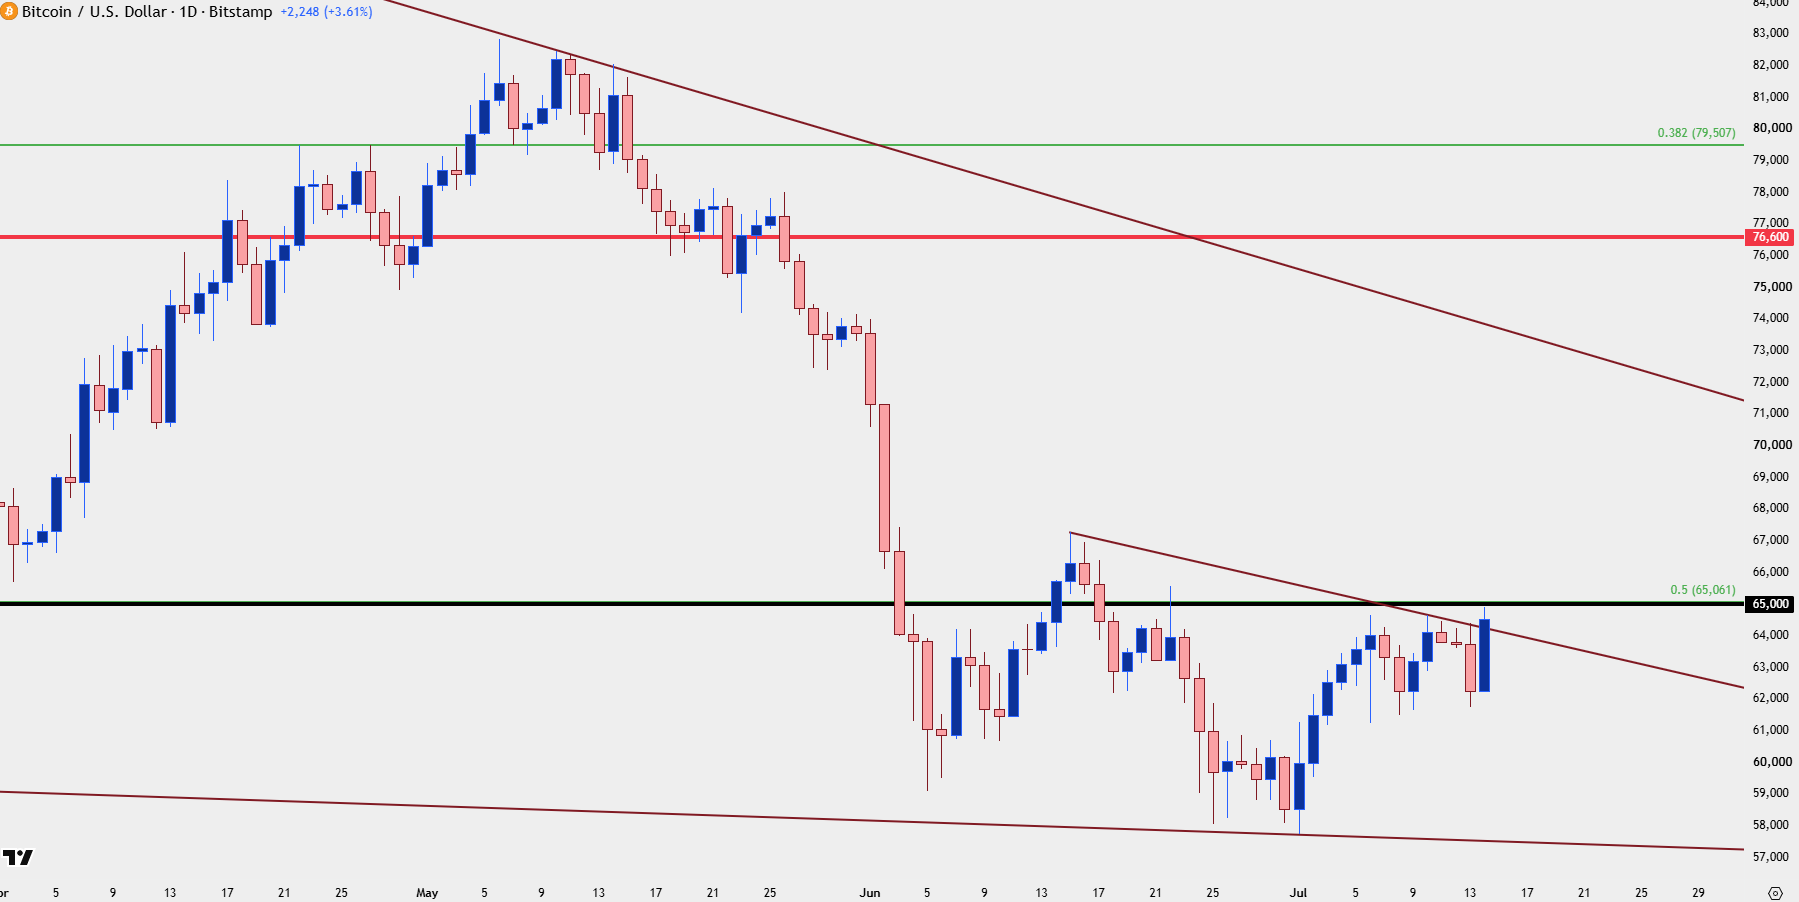
Chart prepared by James Stanley; data derived from Tradingview
--- written by James Stanley, Senior Market Analyst, Global Macro


Open an account in minutes
Experience award-winning platforms with fast and secure execution, and enjoy tight spreads from 0.5 pts on FX and 0.3 pts on indices.
Economic calendar
Web Trader platform
Our sophisticated web-based platform is packed with features.
Related articles
Gold Bulls Treat $4,000 as a Bargain Once Again
Gold bulls defend $4,000 as prices rebound across major currencies. But a strong US dollar, elevated oil prices and the Fed could limit gains.

EUR/USD Outlook: AI sentiment returns as French debt fears fades
French debt was the market's obsession a week ago. Now, short-term correlations suggest technology sentiment may be calling more of the shots, with central bank decisions and heavyweight tech earnings threatening to accelerate the euro's decline.


Gold Analysis: XAU/USD Holds Above Key Support Ahead of the Fed Decision
Over the last few trading sessions, gold has managed to stage a modest recovery. The precious metal has gained more than 1.7% across the last two sessions, a move that has introduced some buying momentum after several weeks of sustained pressure on prices. For now, this rebound appears to be driven largely by the cautious atmosphere dominating markets ahead of the Federal Reserve's monetary policy decision.

This report is intended for general circulation only. It should not be construed as a recommendation, or an offer (or solicitation of an offer) to buy or sell any financial products. The information provided does not take into account your specific investment objectives, financial situation or particular needs. Before you act on any recommendation that may be contained in this report, independent advice ought to be sought from a financial adviser regarding the suitability of the investment product, taking into account your specific investment objectives, financial situation or particular needs.
StoneX Financial Pte. Ltd., may distribute reports produced by its respective foreign entities or affiliates within the StoneX group of companies or third parties pursuant to an arrangement under Regulation 32C of the Financial Advisers Regulations. Where the report is distributed to a person in Singapore who is not an accredited investor, expert investor or an institutional investor (as defined in the Securities Futures Act), StoneX Financial Pte. Ltd. accepts legal responsibility to such persons for the contents of the report only to the extent required by law. Singapore recipients should contact StoneX Financial Pte. Ltd. at 6826 9988 for matters arising from, or in connection with the report.
In the case of all other recipients of this report, to the extent permitted by applicable laws and regulations neither StoneX Financial Pte. Ltd. nor its associated companies will be responsible or liable for any loss or damage incurred arising out of, or in connection with, any use of the information contained in this report and all such liability is hereby expressly disclaimed. No representation or warranty is made, express or implied, that the content of this report is complete or accurate.
StoneX Financial Pte. Ltd. is not under any obligation to update this report.
Trading CFDs carries a high level of risk that may not be suitable for some investors. Consider your investment objectives, level of experience, financial resources, risk appetite and other relevant circumstances carefully. The possibility exists that you could lose some or all of your investments, including your initial deposits. If in doubt, please seek independent expert advice. Visit www.forex.com/en-sg/terms-and-policies for the complete Risk Disclosure Statement.