



US small caps at key level as Iran, crude and rates converge
The Russell 2000 is back at a key level traders can use to assess setups, with Iran developments likely to decide direction.
Share this:

- Iran headlines dictating the outlook for energy and rates
- Russell 2000 acting as a proxy for the US economic outlook
- 2560 a key level to watch this week
Rusell rebounds as yields, energy decline
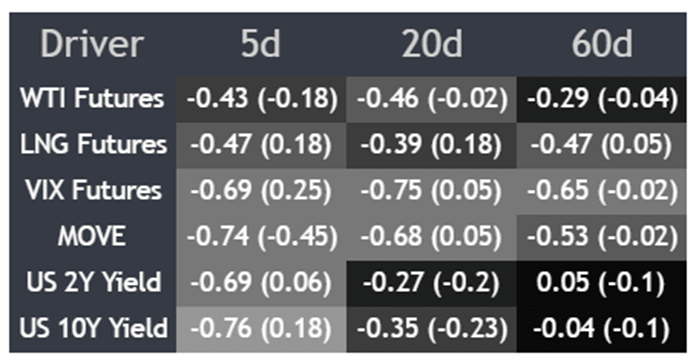
The Russell 2000 has rebounded in recent days on the back of declines in energy prices and Treasury yields, reinforcing that it remains a high-beta play on sentiment towards the US economic outlook, rather than simply a bet on AI like some of the larger cap US indices.
Source: Tradingview
You can see that in the correlation matrix above, which tracks the index’s movements against a range of economic and market indicators over the past week, month and quarter. While a mild inverse correlation has been seen with WTI crude futures and Henry Hub natural gas over much of the past month, it’s the strengthening relationship with US Treasury yields that stands out this week. Reinforcing its highly speculative nature, the Russell also continues to demonstrate a strong inverse relationship with US stock and bond volatility measures.
It remains a rates-linked, sentiment-driven index to trade.
2560 in focus
Source: Tradingview
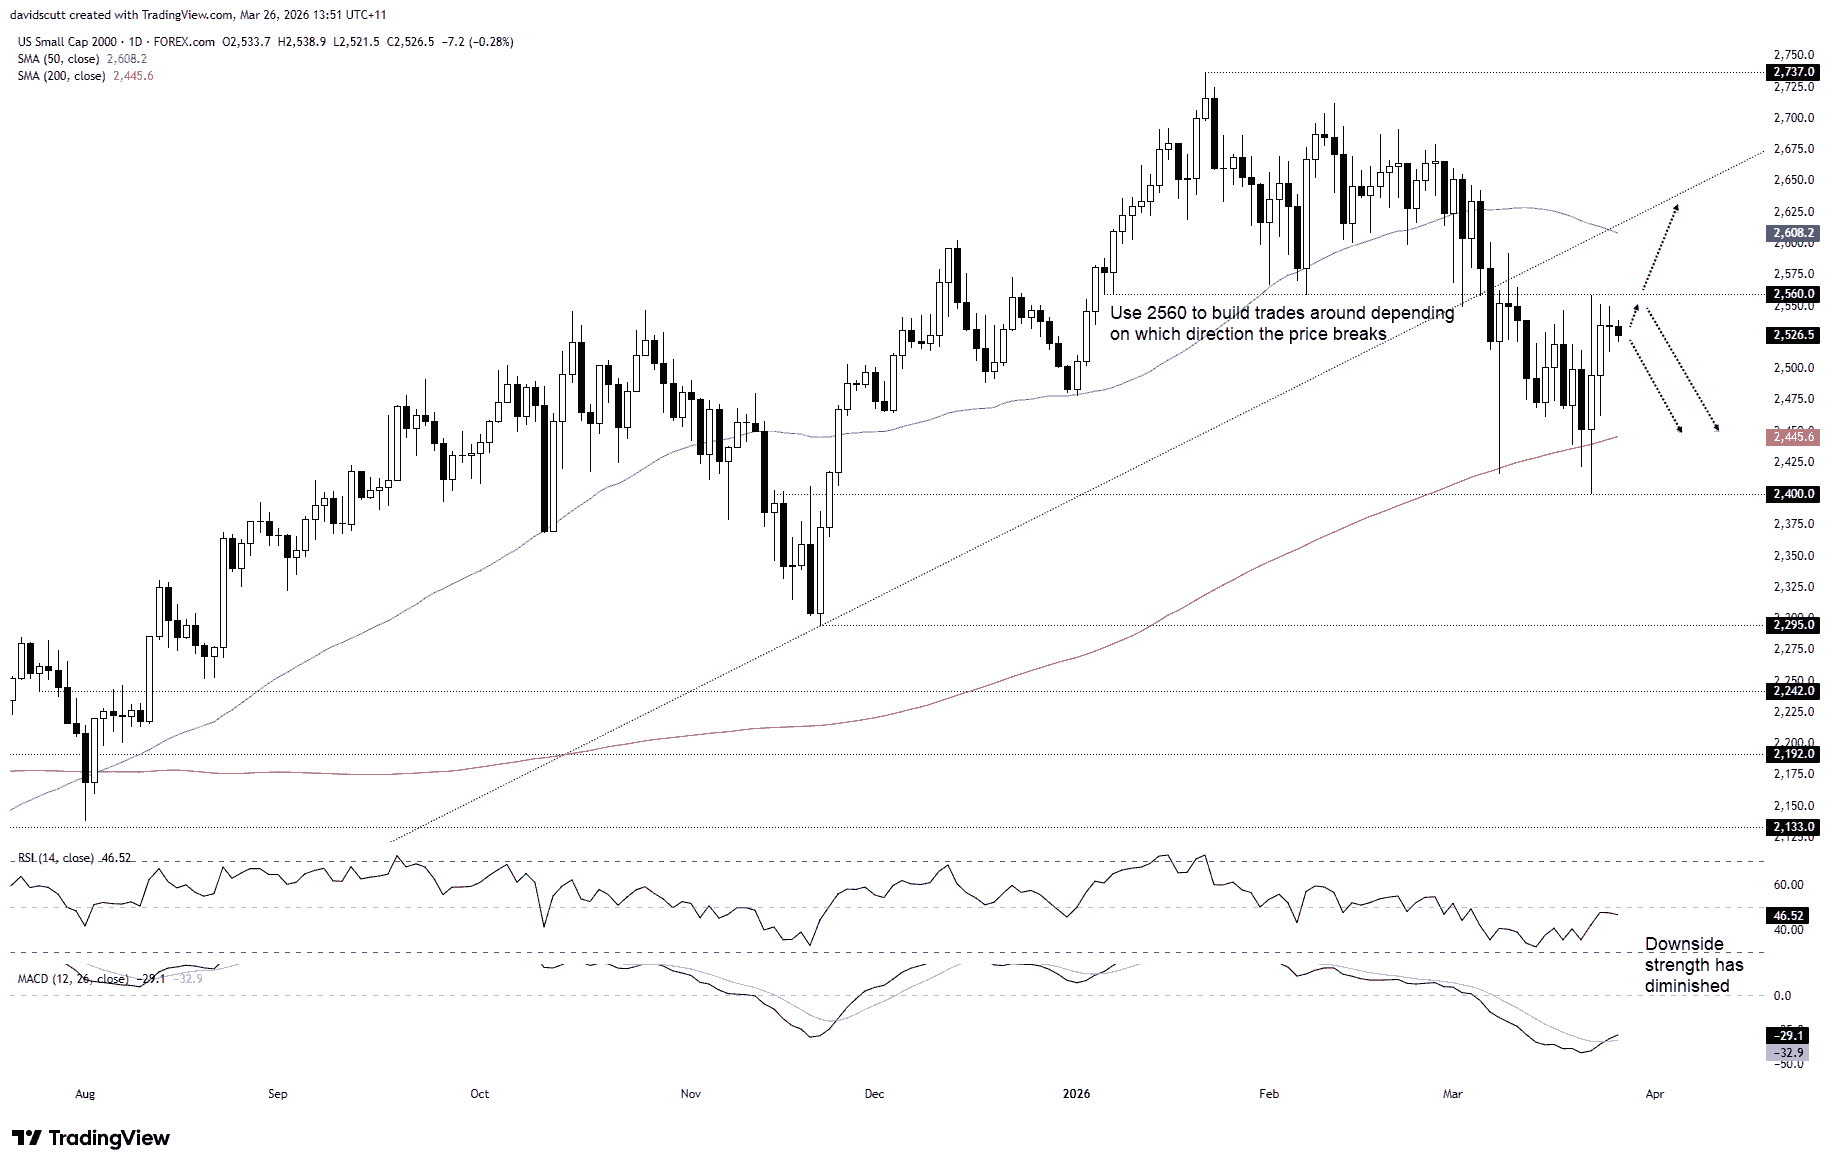
As a result of the latest rebound, the price has gravitated back towards 2560, a former support level that’s now acting as resistance. Its proximity means it can be used for risk management when initiating trades, allowing for a stop to be placed on the opposite side of entry.
If the price remains capped beneath 2560, shorts could be set with a stop above, targeting the 200DMA initially or, beyond that, support at 2400. Alternatively, if we see a break above 2560, longs could be set with a stop below, targeting the 50DMA initially, with the April 2025 uptrend and 2680 other options before the record high of 2737 set in January.
The message from the oscillators is more neutral than bearish when it comes to directional bias. RSI (14) sits marginally beneath 50 and has been grinding higher, while MACD has crossed the signal line from below but remains in negative territory. With no clear evidence that bulls or bears are gaining the upper hand, it’s a reminder to keep an open mind when assessing potential setups.
I have no strong view on near-term directional risks given how fluid headlines relating to the Iran war remain, but positive news will likely benefit the Russell, or weigh significantly if tensions escalate again, given the linkages between energy prices, the interest rate outlook and, eventually, economic growth.


Open an account in minutes
Experience award-winning platforms with fast and secure execution, and enjoy tight spreads from 0.5 pts on FX and 0.3 pts on indices.
Economic calendar
Web Trader platform
Our sophisticated web-based platform is packed with features.
Related articles

US Dollar Bulls Got Everything They Wanted. Except a Rally.
Bond bears had every excuse to wreak havoc after September's inflation surprise. Instead, buyers returned aggressively, leaving Treasury futures threatening to bottom and the dollar struggling to extend its rally.

AUD/USD and AUD/JPY Tease Swing Highs Heading into Jobs Report
AUD/USD and AUD/JPY show signs of potential swing highs as bearish reversal candles emerge ahead of Australia's employment report.

Canadian Dollar Short-term Outlook: USD/CAD Five-Week Rally Hits a Wall at Major Resistance 10 14 2026
USD/CAD is holding near fresh yearly highs, but bearish divergence and a well-defined October range raise the stakes at major resistance.

This report is intended for general circulation only. It should not be construed as a recommendation, or an offer (or solicitation of an offer) to buy or sell any financial products. The information provided does not take into account your specific investment objectives, financial situation or particular needs. Before you act on any recommendation that may be contained in this report, independent advice ought to be sought from a financial adviser regarding the suitability of the investment product, taking into account your specific investment objectives, financial situation or particular needs.
StoneX Financial Pte. Ltd., may distribute reports produced by its respective foreign entities or affiliates within the StoneX group of companies or third parties pursuant to an arrangement under Regulation 32C of the Financial Advisers Regulations. Where the report is distributed to a person in Singapore who is not an accredited investor, expert investor or an institutional investor (as defined in the Securities Futures Act), StoneX Financial Pte. Ltd. accepts legal responsibility to such persons for the contents of the report only to the extent required by law. Singapore recipients should contact StoneX Financial Pte. Ltd. at 6826 9988 for matters arising from, or in connection with the report.
In the case of all other recipients of this report, to the extent permitted by applicable laws and regulations neither StoneX Financial Pte. Ltd. nor its associated companies will be responsible or liable for any loss or damage incurred arising out of, or in connection with, any use of the information contained in this report and all such liability is hereby expressly disclaimed. No representation or warranty is made, express or implied, that the content of this report is complete or accurate.
StoneX Financial Pte. Ltd. is not under any obligation to update this report.
Trading CFDs carries a high level of risk that may not be suitable for some investors. Consider your investment objectives, level of experience, financial resources, risk appetite and other relevant circumstances carefully. The possibility exists that you could lose some or all of your investments, including your initial deposits. If in doubt, please seek independent expert advice. Visit www.forex.com/en-sg/terms-and-policies for the complete Risk Disclosure Statement.