



USD/CAD Knocked from Its Perch as US Dollar Rally Pauses for Breath
USD/CAD retreats from stretched highs as the US dollar rally cools, with softer yields, Canadian trade strength and crude oil in focus.
Share this:

The US dollar rally has finally lost some momentum after three strong weeks, allowing USD/CAD to retreat from its cycle high. Softer US data, reduced Fed hike bets and easing Treasury yields have weighed on the greenback, while a strong Canadian trade surplus and the prospect of firmer crude oil add to the case for a near-term USD/CAD pullback.
View related analysis:
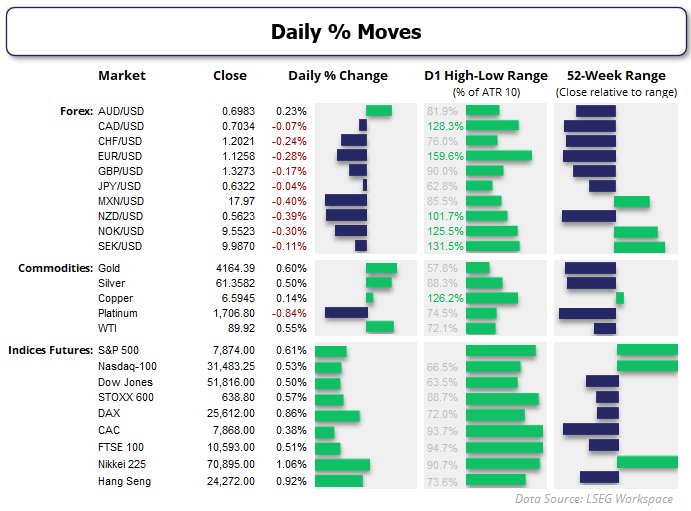
USD/CAD Retreats as the US Dollar Rally Loses Momentum
A weak payrolls report and slightly softer headline ISM services print helped the US dollar index retreat further from Monday’s cycle high, as Fed hike bets were scaled back. The bond-market selloff also stabilised to pull Treasury yields a touch lower, though they remain firmly elevated. Trade data showed imports surged 4.3% to a record $420.8 billion, widening the deficit to $105.6 billion and building the case for weaker growth.
A firmer euro also contributed to US dollar weakness, with bets of an ECB hike in December rising to 80%. French bond yields also pulled back from their highs as bond-market stress eased.
The weaker US dollar helped USD/CAD pull back from arguably stretched highs, aided by an unexpectedly strong Canadian trade surplus. Commodity FX was higher in general, with NZD/USD the strongest FX major and AUD/USD rising for a third day, in line with my near-term bias. It seems markets are taking advantage of the minor reprieve from the US dollar rally, while risk appetite on Wall Street amid earnings optimism also helped.
US Dollar Index (DXY) Technical Analysis
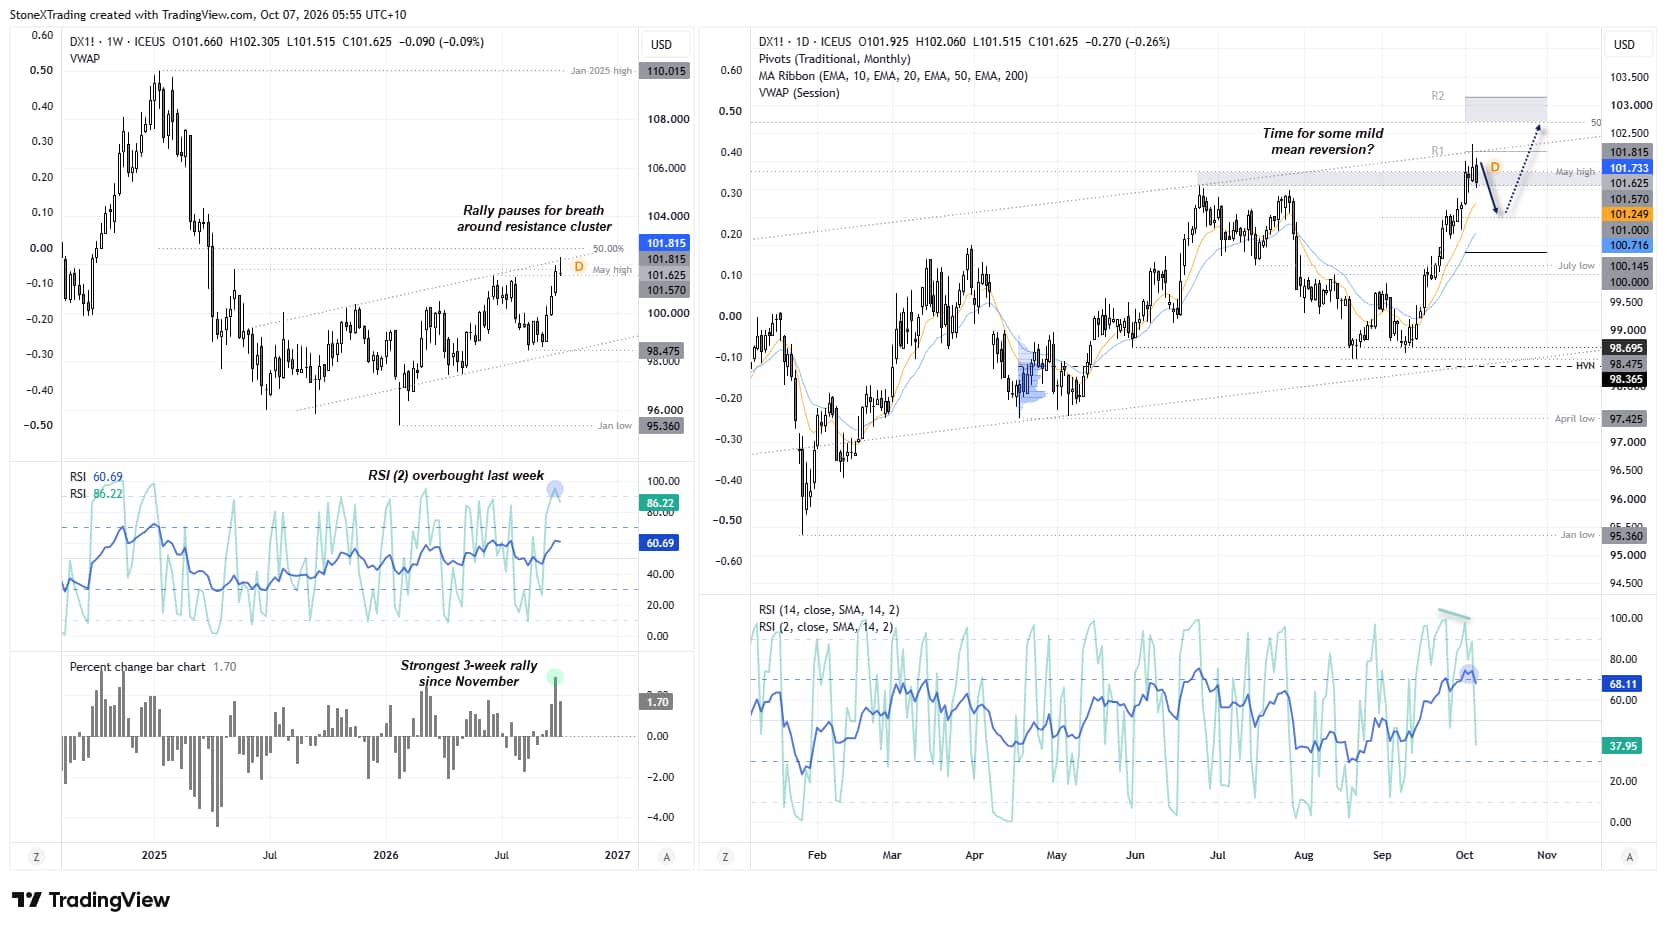
We have just witnessed the strongest three-week rally for the US dollar index since November, but with resistance on hand, a pause in the trend – if not a pullback – is arguably due. The fact that payrolls undermined the rally strengthens the case for momentum to lose steam over the near term.
DXY Weekly Chart Points to a Pause
We’re not even halfway through the week, but DXY is on track for a bearish pinbar should it close around current levels or lower by Friday. Note that prices are back below the May high, while this week’s high has so far respected the upper trend-channel resistance and has not yet managed to test the 50% retracement level between the January 2025 high and January 2026 low. The weekly RSI (2) was also heavily overbought last week.
The daily chart shows a small bearish engulfing candle formed on Tuesday, following a wide-bodied shooting star on Monday. A bearish divergence also formed on the daily RSI (2) within the overbought zone, while RSI (14) is now curling lower from its own overbought zone.
US Dollar Pullback Could Remain Shallow
None of this points to a sharp pullback at this stage, and we should keep in mind the strength of the three-week rally that took us to these levels. But with a lack of top-tier data aside from the FOMC minutes, we could now find volatility across FX majors remains on the lower side while a shallow pullback plays out on DXY.
Source: ICE, TradingView
USD/CAD Technical Analysis: US Dollar vs Canadian Dollar
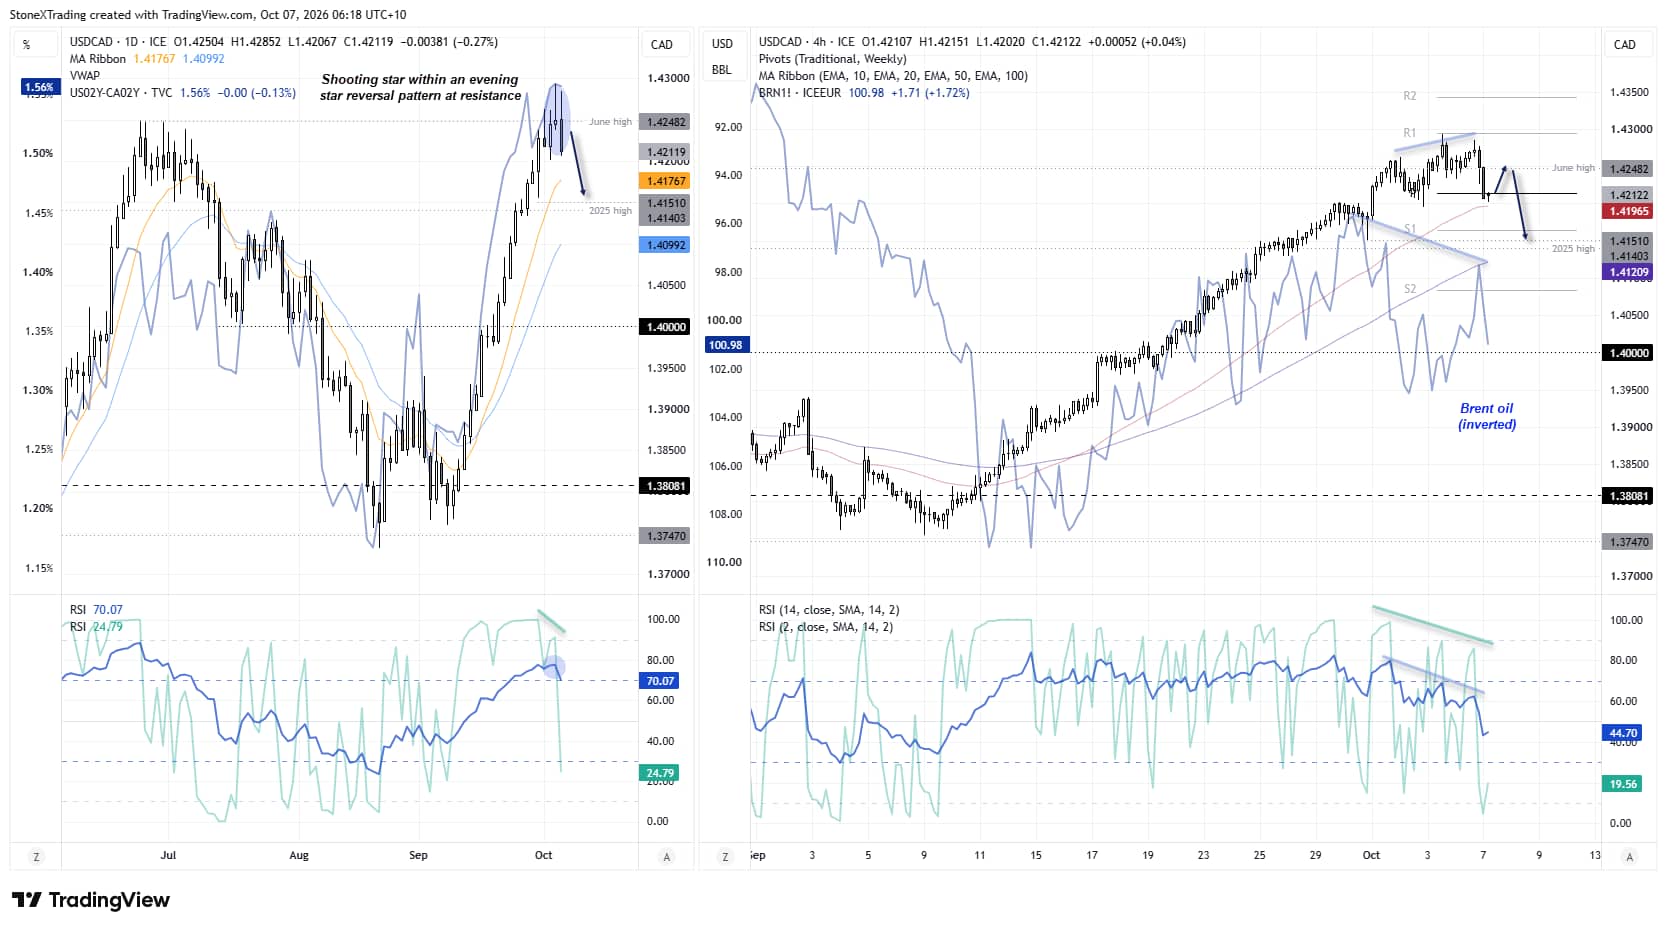
Widening yield differentials between the US and Canada helped USD/CAD enjoy its best three-week rally since December 2024. With the US-Canada 2-year spread remaining pinned near cycle highs, I am not on guard for a deep pullback on USD/CAD.
But given the rally has stalled around the June high, with a shooting star candle followed by bearish range expansion, perhaps a pullback to the 10-day EMA at a minimum is due. And like the US dollar index, the daily RSI (2) on USD/CAD formed a bearish divergence within its overbought zone, while RSI (14) is curling lower from its own overbought zone.

Crude Oil Bounce Could Deepen the USD/CAD Pullback
The 4-hour chart shows support has been found around its 50-bar EMA and weekly pivot point, while RSI (2) is heavily oversold. Perhaps bears may be seeking to fade into moves towards the June high and maintain a near-term bearish bias while USD/CAD remains beneath Monday’s high.
Note the Brent futures chart I have overlaid is inverted, as it tends to correlate positively with USD/CAD. So if oil prices bounce – which I have a hunch they may – it could build the case for a slightly deeper pullback in USD/CAD over the near term.
Source: ICE, TradingView
Related tags:
Latest market news




Open an account in minutes
Experience award-winning platforms with fast and secure execution, and enjoy tight spreads from 0.5 pts on FX and 0.3 pts on indices.
Economic calendar
Web Trader platform
Our sophisticated web-based platform is packed with features.
Related articles
NZD/USD reversal case strengthens as Fed pricing cools
NZD/USD has triggered a bullish reversal after a punishing two-month decline, with less hawkish Fed pricing and an aggressive RBNZ rates path providing fuel for a rebound.
USD/CAD Knocked from Its Perch as US Dollar Rally Pauses for Breath
USD/CAD retreats from stretched highs as the US dollar rally cools, with softer yields, Canadian trade strength and crude oil in focus.
US Dollar Price Action Setups: EUR/USD, GBP/USD, USD/JPY, USD/CAD, Gold
The US Dollar hit a fresh yearly high and is currently testing above a major level, but EUR/USD has already pushed into extreme territory and that begs the question around continuation potential in each market. Meanwhile, USD/JPY retains bullish short-term structure.

This report is intended for general circulation only. It should not be construed as a recommendation, or an offer (or solicitation of an offer) to buy or sell any financial products. The information provided does not take into account your specific investment objectives, financial situation or particular needs. Before you act on any recommendation that may be contained in this report, independent advice ought to be sought from a financial adviser regarding the suitability of the investment product, taking into account your specific investment objectives, financial situation or particular needs.
StoneX Financial Pte. Ltd., may distribute reports produced by its respective foreign entities or affiliates within the StoneX group of companies or third parties pursuant to an arrangement under Regulation 32C of the Financial Advisers Regulations. Where the report is distributed to a person in Singapore who is not an accredited investor, expert investor or an institutional investor (as defined in the Securities Futures Act), StoneX Financial Pte. Ltd. accepts legal responsibility to such persons for the contents of the report only to the extent required by law. Singapore recipients should contact StoneX Financial Pte. Ltd. at 6826 9988 for matters arising from, or in connection with the report.
In the case of all other recipients of this report, to the extent permitted by applicable laws and regulations neither StoneX Financial Pte. Ltd. nor its associated companies will be responsible or liable for any loss or damage incurred arising out of, or in connection with, any use of the information contained in this report and all such liability is hereby expressly disclaimed. No representation or warranty is made, express or implied, that the content of this report is complete or accurate.
StoneX Financial Pte. Ltd. is not under any obligation to update this report.
Trading CFDs carries a high level of risk that may not be suitable for some investors. Consider your investment objectives, level of experience, financial resources, risk appetite and other relevant circumstances carefully. The possibility exists that you could lose some or all of your investments, including your initial deposits. If in doubt, please seek independent expert advice. Visit www.forex.com/en-sg/terms-and-policies for the complete Risk Disclosure Statement.