


USD/JPY, DXY Outlook: Hawkish Holds and Key Resistance Levels
USD/JPY and DXY face key resistance levels as markets weigh Fed and BOJ rate expectations, inflation and geopolitical developments
Share this:

Market expectations for Fed and BOJ rate hikes in December are still on the table following this week’s central bank meetings and persistent geopolitical instability. Key resistance levels are in focus as markets navigate central-bank guidance, inflation pressures and, most importantly, geopolitical developments. The inconclusive Israeli election results and the upcoming U.S. midterm elections next Tuesday add uncertainty to the ongoing conflict with Iran and its proxies. These developments could influence decisions related to the conflict, as well as crude oil prices, inflation trends, central-bank guidance and corporate earnings outlooks.
December Rate Expectations
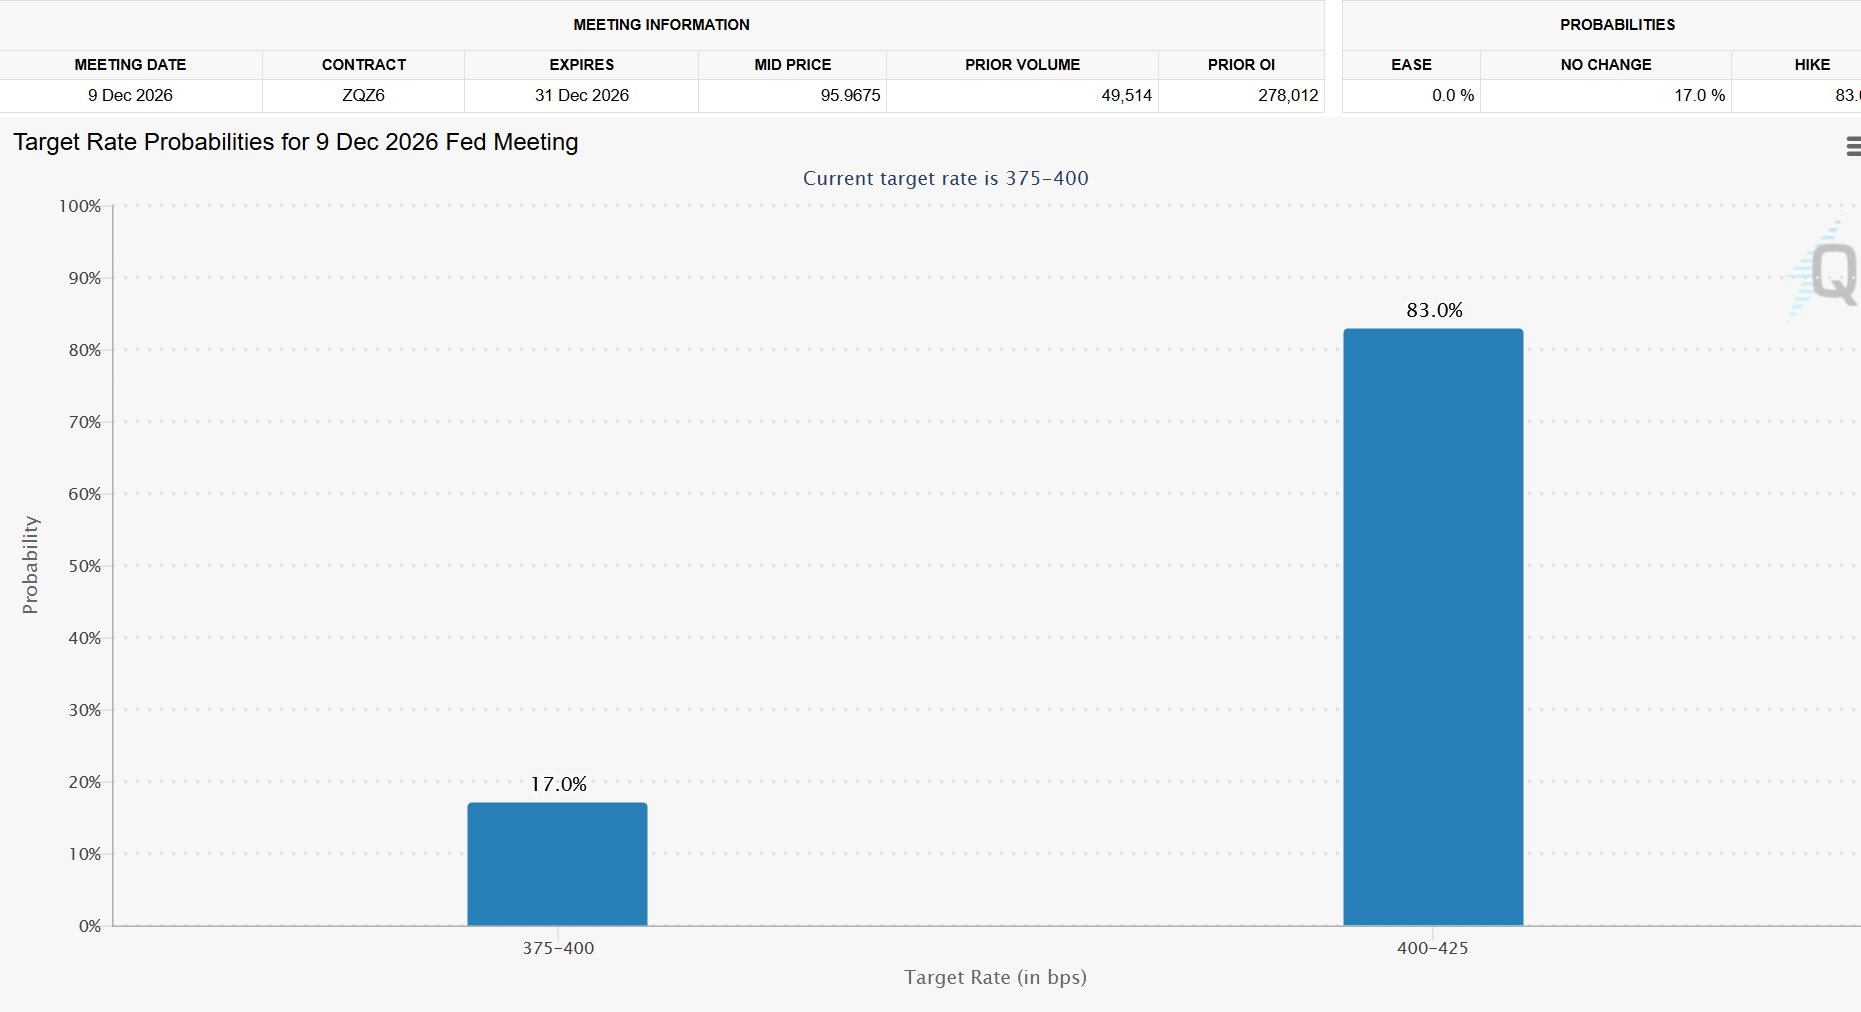
Source: CME Fed Watch Tool
December Fed rate-hike expectations are above 80%, helping keep the U.S. dollar index and dollar pairs on a relatively bullish footing against other currencies. Persistent inflation pressures are supporting this outlook: U.S. CPI rose to 3.7% in September, while Tokyo core CPI reached 2.7% that month, both above their central banks’ 2% targets.
Technically speaking:
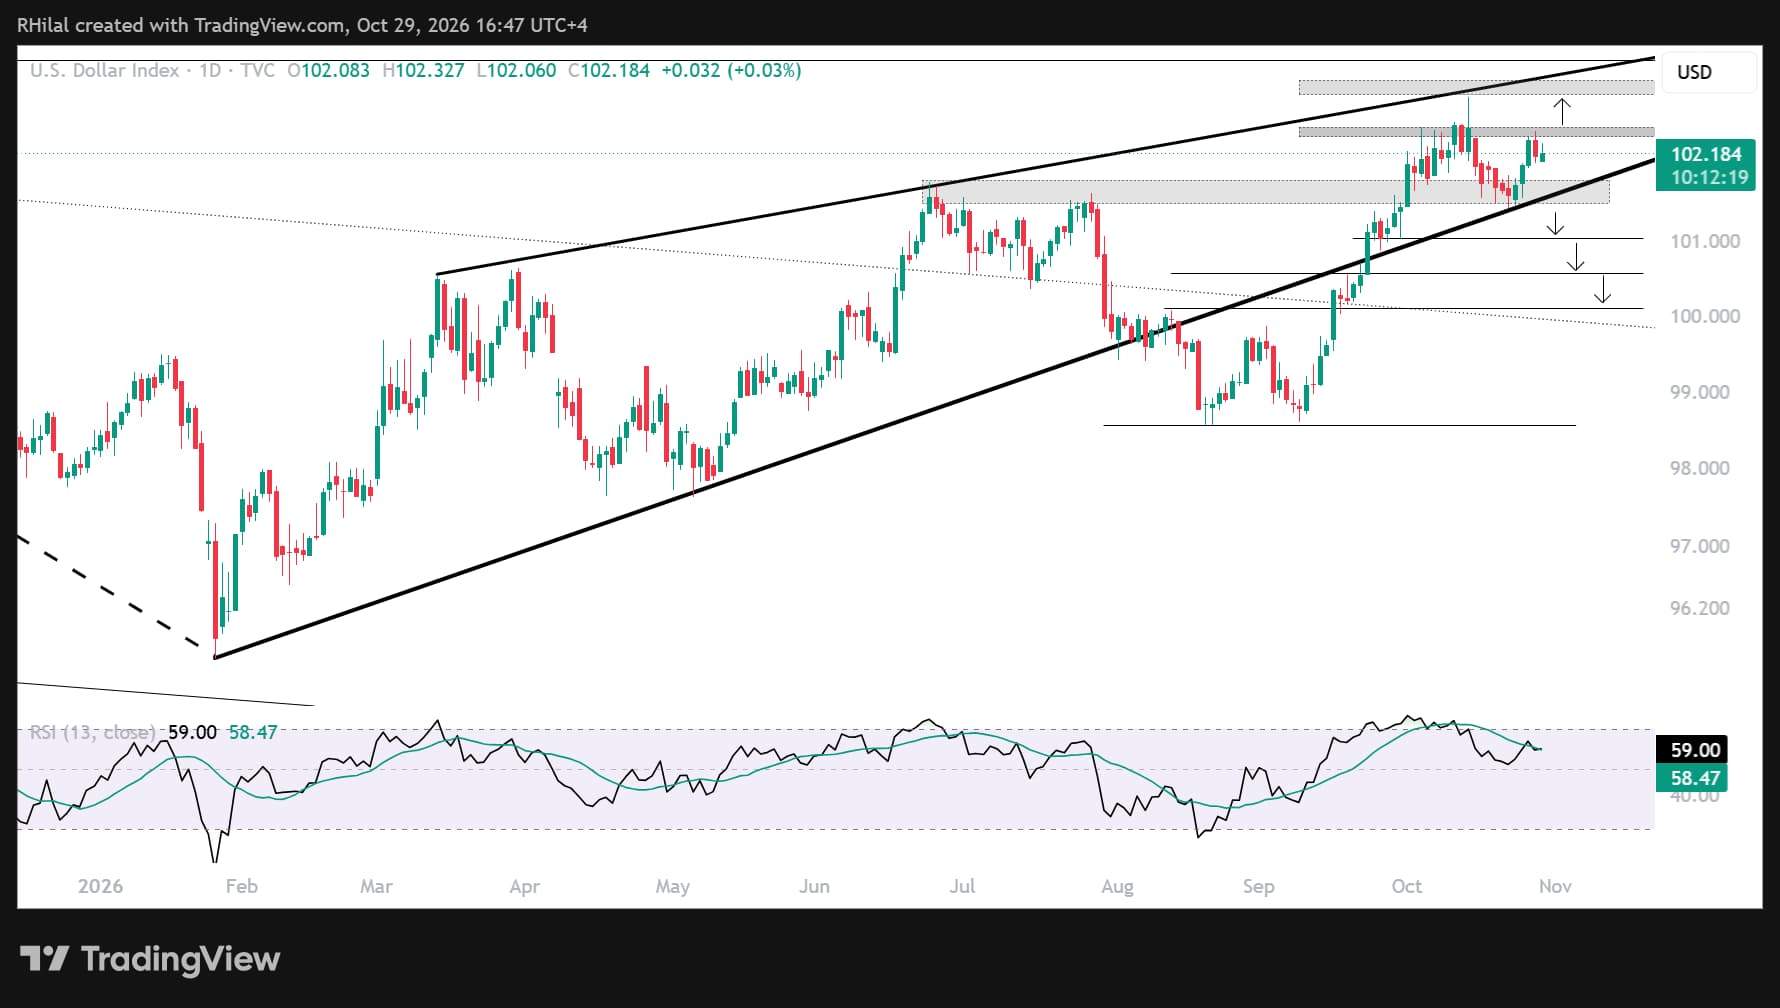
- DXY: The index is trading near yearly highs above 102 and facing an eight-month rising resistance line near 103.40. This is a key barrier between longer-term bullish continuation and bearish reversal risks.
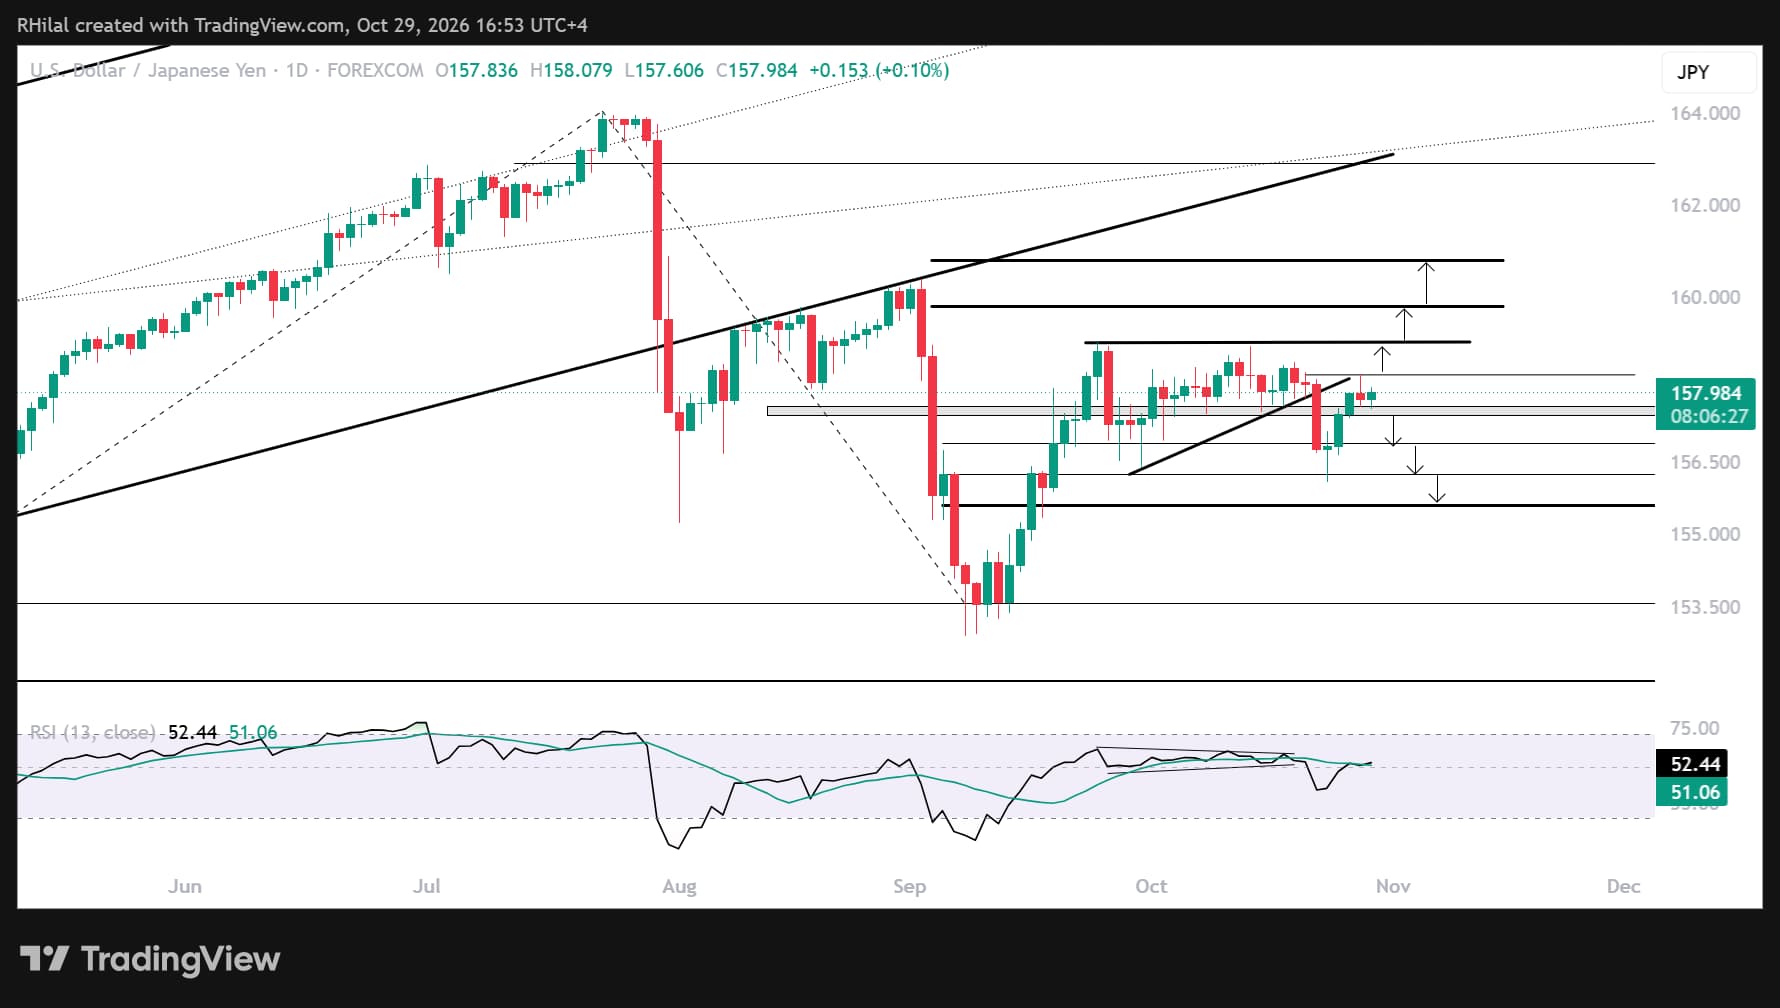
- USD/JPY: The pair is holding its bullish, impulsive rebound from 152.90 and daily oversold conditions last seen in 2024. This keeps the yen technically weaker relative to the dollar, despite hawkish December outlooks for both central banks.
- U.S. 10-year Treasury yields: Yields are holding cautiously above 4.93%, keeping bullish risks for the U.S. dollar on the table.
I cover these setups in my weekly webinar, held every Tuesday.
U.S. 10-Year Treasury Yield Outlook: Three-Day Time Frame – Log Scale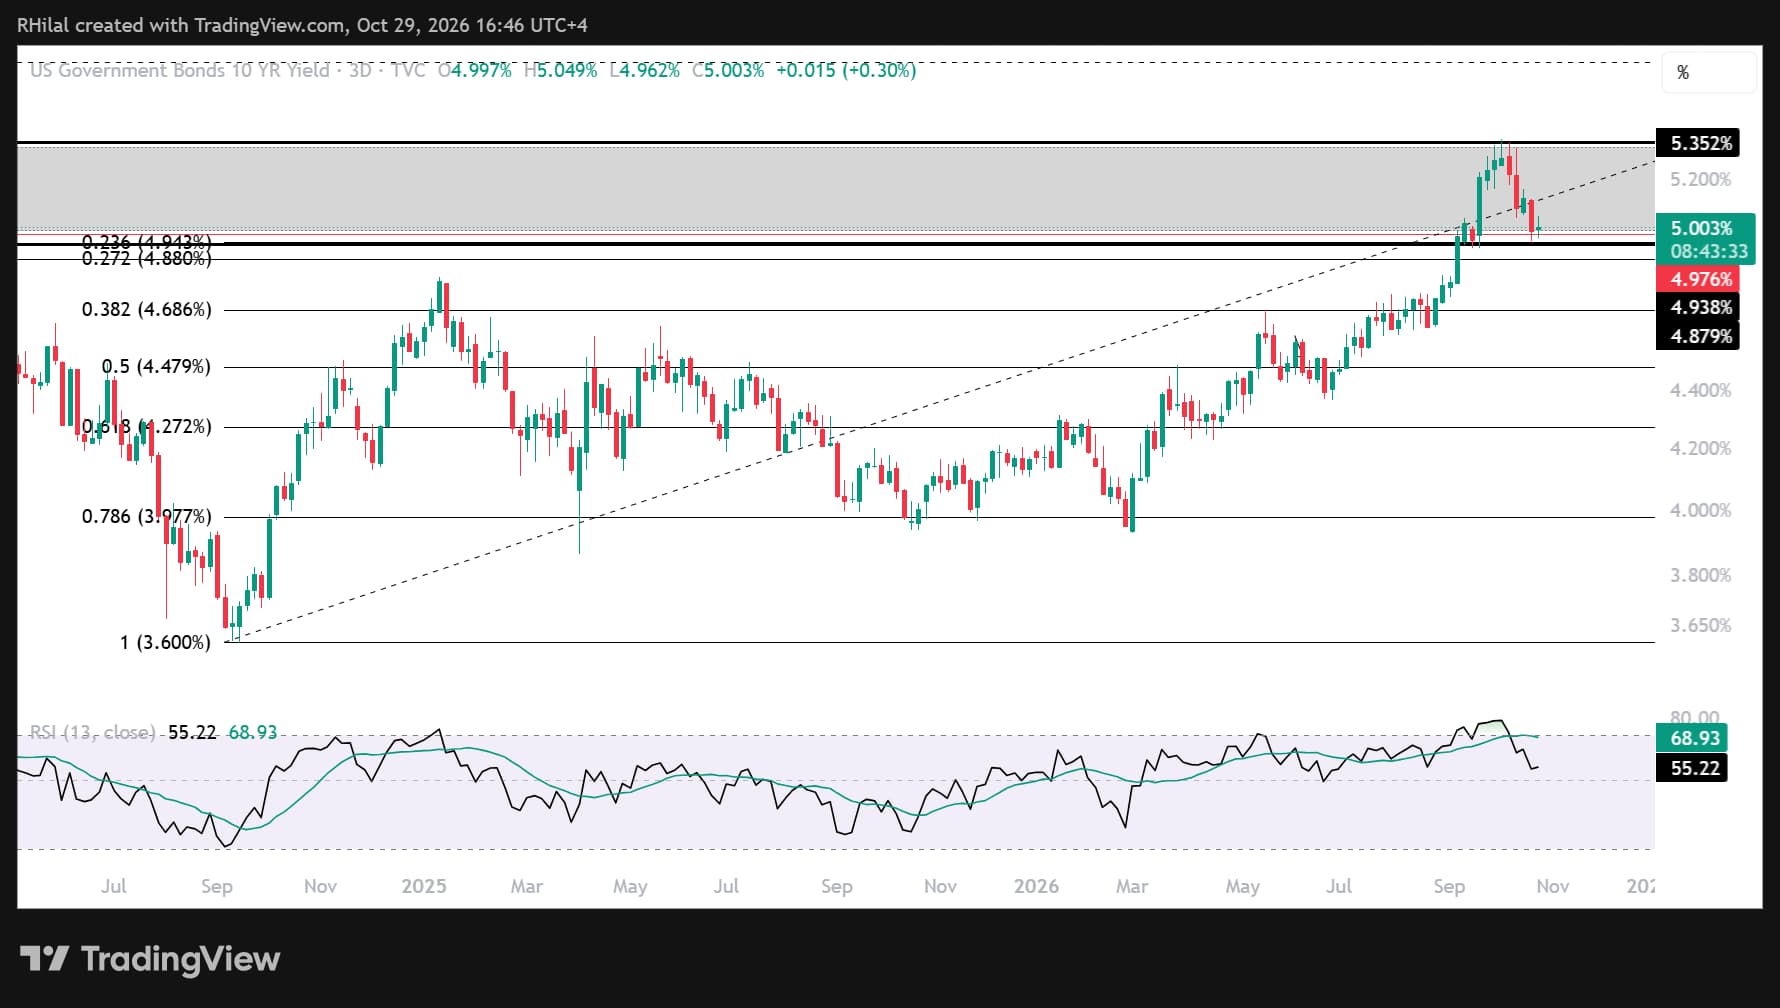
Source: Trading View
On the three-day chart, U.S. 10-year Treasury yields are testing a key Fibonacci retracement zone near 4.93%, based on the September 2024–October 2026 advance.
This support aligns with the 23.6% retracement. A break below 4.93%, followed by a move below the 27.2% retracement near 4.88%, would expose yields to a steeper drawdown and could weigh on the latest dollar rally.
On the upside, a sustained hold above 4.93% and a move back above 5.20% would bring yearly highs back into view on both yield charts and support further gains in the U.S. dollar and its pairs.
DXY Outlook: Daily Time Frame – Log Scale
Source: TradingView
The DXY is pulling back after closing near its yearly highs and facing resistance near 102.60, with markets weighing Fed expectations and an uncertain geopolitical outlook. A break above 102.60 would expose the yearly high near 103, followed by the eight-month rising resistance around 103.20 and 103.50.
These levels could bring another pullback risk into focus as daily RSI approaches overbought conditions last seen in September, July and March, which aligned with notable reversals on the chart.
A sustained move above the eight-month resistance near 103.50, followed by a hold above that level, would strengthen the longer-term bullish outlook. On the downside, a break below 101.80–101.50—the rising support connecting higher lows across the year—would expose the psychological 100 level and could invalidate the current setup.
USD/JPY Outlook: Daily Time Frame – Log Scale
Source: TradingView
USD/JPY has been trading in a sideways range since September 2026, below 159 and above 156.
If the rebound from 152.60 is impulsive, a breakout above 158.30 would expose 159. That level could trigger another pullback or give way to a further rally toward 159.80 and 160.80. These levels align with Fibonacci extensions of the wave between the September low and high and the October low.
A sustained break higher would bring the yearly highs—and potentially new multi-decade highs—back into focus, while also raising the risk of BOJ intervention if yen weakness resumes.
On the downside, a break below 156.20, the 50% retracement of the September advance, would expose 155.60, 154.70 and 153.50. These levels align with the 61.8% and 78.6% retracements, while 153.50 also aligns with the September closing lows.
The U.S. midterm elections and upcoming inflation reports are likely to influence market direction this quarter. The outlook remains caught between the risk of further geopolitical escalation and the possibility that tensions are approaching an exhaustion point, as discussed in my crude oil weekly outlook: Crude Oil Weekly Outlook: Elections Test Brent–WTI Resistance Levels
Written by Razan Hilal, CMT
Follow on X: @Rh_waves
Related tags:



Open an account in minutes
Experience award-winning platforms with fast and secure execution, and enjoy tight spreads from 0.5 pts on FX and 0.3 pts on indices.
Economic calendar
Web Trader platform
Our sophisticated web-based platform is packed with features.
Related articles

USD/JPY, DXY Outlook: Hawkish Holds and Key Resistance Levels
USD/JPY and DXY face key resistance levels as markets weigh Fed and BOJ rate expectations, inflation and geopolitical developments

Gold Outlook: Fed credibility takes a hit, but buyers aren't biting
The Fed's inflation-fighting credibility takes another knock, real yields are falling and the dollar is softening. Gold should be flying, yet buyers remain reluctant. What's going on?


USD/JPY and EUR/JPY: Diverging Setups Ahead of ECB and BOJ
USD/JPY stalls at resistance as EUR/JPY forms a falling wedge. Fed, ECB and BOJ rate expectations could determine the yen's next move.

This report is intended for general circulation only. It should not be construed as a recommendation, or an offer (or solicitation of an offer) to buy or sell any financial products. The information provided does not take into account your specific investment objectives, financial situation or particular needs. Before you act on any recommendation that may be contained in this report, independent advice ought to be sought from a financial adviser regarding the suitability of the investment product, taking into account your specific investment objectives, financial situation or particular needs.
StoneX Financial Pte. Ltd., may distribute reports produced by its respective foreign entities or affiliates within the StoneX group of companies or third parties pursuant to an arrangement under Regulation 32C of the Financial Advisers Regulations. Where the report is distributed to a person in Singapore who is not an accredited investor, expert investor or an institutional investor (as defined in the Securities Futures Act), StoneX Financial Pte. Ltd. accepts legal responsibility to such persons for the contents of the report only to the extent required by law. Singapore recipients should contact StoneX Financial Pte. Ltd. at 6826 9988 for matters arising from, or in connection with the report.
In the case of all other recipients of this report, to the extent permitted by applicable laws and regulations neither StoneX Financial Pte. Ltd. nor its associated companies will be responsible or liable for any loss or damage incurred arising out of, or in connection with, any use of the information contained in this report and all such liability is hereby expressly disclaimed. No representation or warranty is made, express or implied, that the content of this report is complete or accurate.
StoneX Financial Pte. Ltd. is not under any obligation to update this report.
Trading CFDs carries a high level of risk that may not be suitable for some investors. Consider your investment objectives, level of experience, financial resources, risk appetite and other relevant circumstances carefully. The possibility exists that you could lose some or all of your investments, including your initial deposits. If in doubt, please seek independent expert advice. Visit www.forex.com/en-sg/terms-and-policies for the complete Risk Disclosure Statement.