



USD/JPY, FTSE 100 Forecast: Two trades to watch
USD/JPY rises amid concerns about the US-Iran ceasefire holding. FTSE 100 falls on ceasefire doubts.
Share this:



USD/JPY rises as oil prices rise amid concerns over the US-Iran ceasefire lasting
The U.S. dollar is rebounding against the Japanese yen on Thursday, with USD/JPY moving back towards 159 after snapping a three-day losing streak, as markets reassess the durability of the U.S.-Iran ceasefire.
Initial optimism over the two-week truce had triggered broad dollar weakness, but that reaction is now being partially reversed as investors question whether the ceasefire will hold. The agreement already appears fragile, with Israel continuing its parallel conflict with Hezbollah in Lebanon, while Iran has accused the U.S. of breaching the terms of the deal.
President Trump also said U.S. military personnel and naval assets would remain in and around the region until a final agreement is fully secured, underscoring the risk that tensions could quickly re-escalate.
At the same time, Iran is keeping the Strait of Hormuz effectively closed, pushing oil prices back higher after yesterday’s 15% drop. That is particularly important for Japan, which remains heavily reliant on imported energy. Higher oil prices raise the risk of imported inflation and a more stagflationary backdrop for the Japanese economy.
BoJ policy is ringing little relief today despite BoJ Governor Kazuo Ueda saying real interest rates remain clearly negative, keeping financial conditions highly accommodative and reinforcing expectations that the BoJ could still tighten policy further if inflation proves persistent.
On the data front, U.S. core PCE inflation and fourth-quarter GDP are due later, but both releases are backwards-looking and predate the latest Middle East developments, meaning their market impact may be limited unless they produce a major surprise.
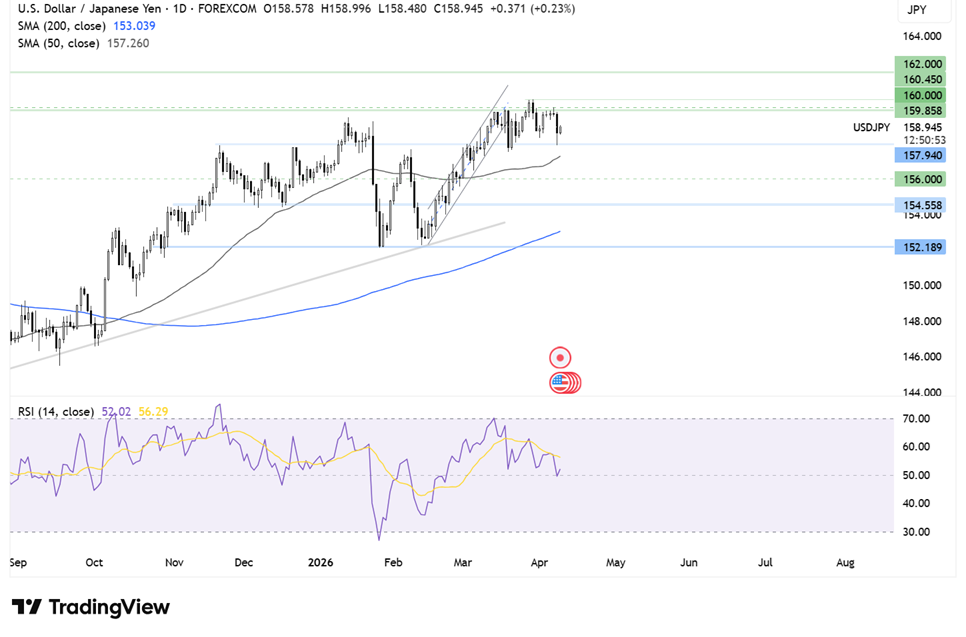
USD/JPY forecast – technical analysis
USD/JPY’s recovery from 152.25 in early February ran into resistance at 160.45. The price eased back and has been trading in a holding pattern, capped on the upside by 160.00 and by 157.75 support region on the lower side.
This set-up lends itself to a breakout trade. Buyers will look for a move above 160.00 to reach 162.00, the 2024 high, into play.
Sellers will look for a break below 157.75 to expose the 50 SMA at 157.25. Below here 156.00 the round number comes into play.
FTSE 100 falls on doubts over the ceasefire lasting
The FTSE 100 is pulling back on Thursday after strong gains in the previous session, as markets focus on the fragility of the U.S.-Iran ceasefire and the prospect of a lasting agreement.
Iran has already dismissed the possibility of continued talks with the U.S., while the Strait of Hormuz remains shut, helping lift oil prices by around 3% today after yesterday's sharp falls. That renewed rise in energy prices is once again feeding inflation concerns and weighing on broader risk appetite.
Markets are now pricing in at least one Bank of England rate hike this year, although that is still a much less aggressive outlook than the three hikes priced in at the peak of the Middle East conflict. The key question now is whether renewed energy pressure forces central banks to remain more hawkish for longer.
Oil majors are rebounding after steep losses yesterday as crude prices recover, while utilities are also outperforming thanks to their defensive characteristics, stable revenues and lower sensitivity to economic uncertainty.
By contrast, more cyclical areas of the market — including miners, banks and housebuilders — are coming under pressure after yesterday’s rally, as investors reduce exposure to sectors most dependent on growth optimism and improving sentiment.
For the FTSE 100, the near-term outlook will depend heavily on whether the ceasefire can hold and whether the Strait of Hormuz reopens. If tensions remain elevated and energy prices continue to creep higher, inflation concerns are likely to re-emerge quickly, limiting the scope for further gains in UK equities.
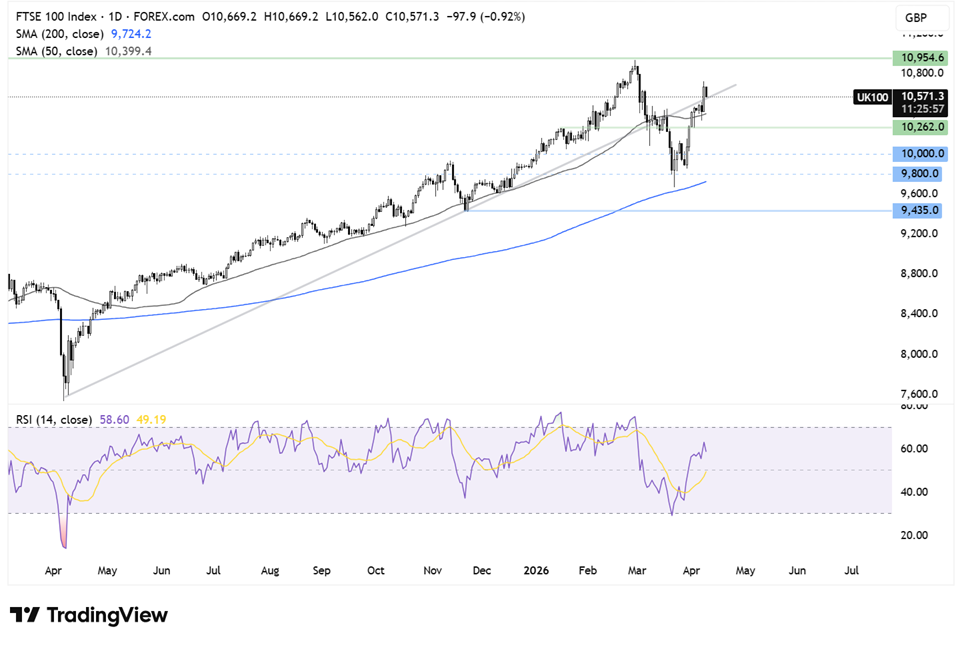
FTSE forecast - technical analysis
The FTSE fell away from its record high, finding support at 9665, around the 200 SMA. The price has rebounded higher, pushing above the 50 SMA and the multi-month rising trendline to a peak of 10,725 yesterday. The price eased back and is testing the rising trendline support.
Should the support hold, buyers will look towards 10,950, the record high.
A break below the support exposes the 50 SMA at 10,390 and below here the 10,270 and 10,000 psychological level.
Related tags:
Latest market news




Open an account in minutes
Experience award-winning platforms with fast and secure execution, and enjoy tight spreads from 0.5 pts on FX and 0.3 pts on indices.
Economic calendar
Web Trader platform
Our sophisticated web-based platform is packed with features.
Related articles

EUR/USD, Gold Forecast: Two trades to watch
EUR/USD rises on USD weakness and as Eurozone inflation hits 4%. Gold – U.S. midterms lift precious metal above $4,000.

US dollar outlook: Nasdaq breakdown raises stakes for EUR/USD, USD/JPY
A potential Democratic sweep of Congress is adding to the AI trade's headaches, with Nasdaq 100 futures breaking below a major technical level. The implications for the dollar could be significant.

Yen Weakness Fuels USD/JPY and EUR/JPY Breakouts Ahead of Midterms
Yen weakness drives USD/JPY and EUR/JPY higher despite intervention risks, with traders eyeing 160 and 180 as US midterm results emerge.

This report is intended for general circulation only. It should not be construed as a recommendation, or an offer (or solicitation of an offer) to buy or sell any financial products. The information provided does not take into account your specific investment objectives, financial situation or particular needs. Before you act on any recommendation that may be contained in this report, independent advice ought to be sought from a financial adviser regarding the suitability of the investment product, taking into account your specific investment objectives, financial situation or particular needs.
StoneX Financial Pte. Ltd., may distribute reports produced by its respective foreign entities or affiliates within the StoneX group of companies or third parties pursuant to an arrangement under Regulation 32C of the Financial Advisers Regulations. Where the report is distributed to a person in Singapore who is not an accredited investor, expert investor or an institutional investor (as defined in the Securities Futures Act), StoneX Financial Pte. Ltd. accepts legal responsibility to such persons for the contents of the report only to the extent required by law. Singapore recipients should contact StoneX Financial Pte. Ltd. at 6826 9988 for matters arising from, or in connection with the report.
In the case of all other recipients of this report, to the extent permitted by applicable laws and regulations neither StoneX Financial Pte. Ltd. nor its associated companies will be responsible or liable for any loss or damage incurred arising out of, or in connection with, any use of the information contained in this report and all such liability is hereby expressly disclaimed. No representation or warranty is made, express or implied, that the content of this report is complete or accurate.
StoneX Financial Pte. Ltd. is not under any obligation to update this report.
Trading CFDs carries a high level of risk that may not be suitable for some investors. Consider your investment objectives, level of experience, financial resources, risk appetite and other relevant circumstances carefully. The possibility exists that you could lose some or all of your investments, including your initial deposits. If in doubt, please seek independent expert advice. Visit www.forex.com/en-sg/terms-and-policies for the complete Risk Disclosure Statement.