



USD/JPY Intervention Threat and the Oil Correlation: EUR/JPY, GBP/JPY
A veiled threat of intervention to start the week did little to reverse the USD/JPY trend, but the Trump comment at the start of US trading seemed to have more pull. Meanwhile EUR/JPY and GBP/JPY are both holding on to bullish formations.
Share this:


While the USD/JPY backdrop was treacherous in late-January and early-February, bulls came back in a big way over the past month and have continued to flirt with a massive line in the sand at the 160.00 handle.
That’s been an area of drama in the pair over the past two years, as it was twice defended in 2024 before a strong reversal took over in July of that year. In 2025, bulls didn’t even want to test that line in the sand, holding highs at 158.88 and then in early trade this year, price got 55 pips away from that level before putting in a strong reversal that was widely rumored or accused to have been intervention.
But it was around the 152.00 level that buyers jumped back in and with the carry still being positive on the long side of the pair and negative on the short side, bulls were able to take back over and drive another push up towards the 160.00 level, with the most recent iteration coming within 10 pips of that level before selling took over last Thursday.
USD/JPY Daily Chart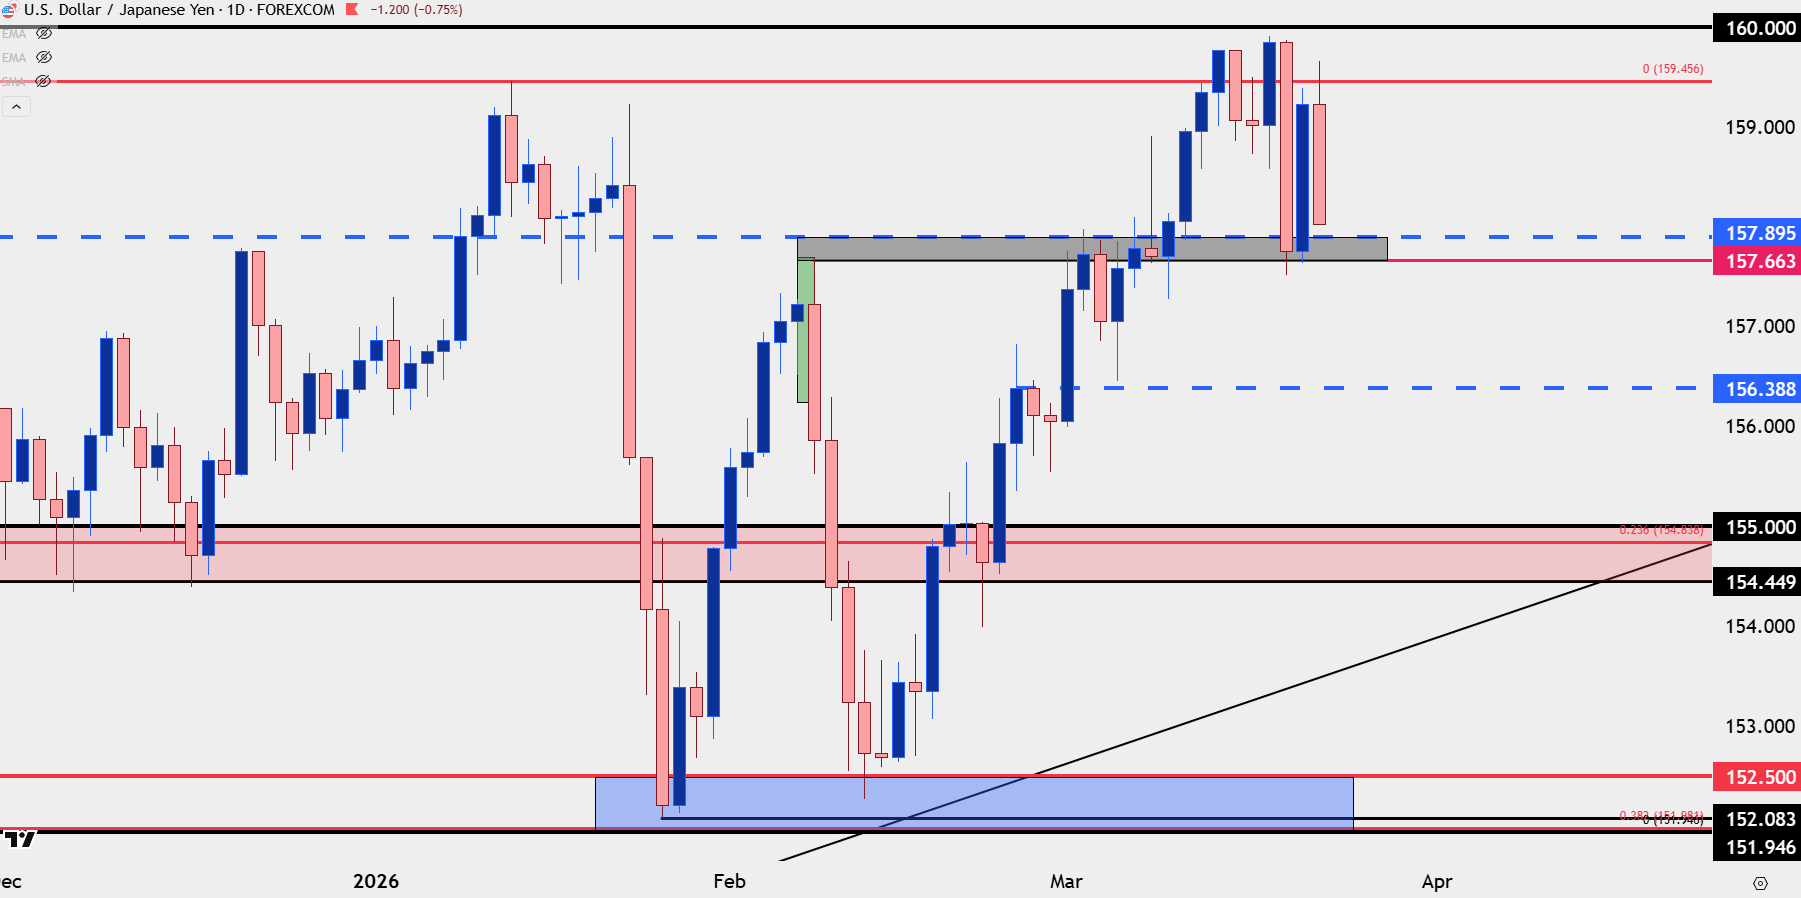
Chart prepared by James Stanley; data derived from Tradingview
USD/JPY and the Oil Correlation
As Oil prices have jumped so far in March, so too has the correlation between USD/JPY and oil futures. On the below daily chart I have the correlation plotted at bottom of the chart and as of right now that correlation is all the way at 0.88, with a 1.0 reading implying perfect correlation.
This matters because the pullback so far today is being helped by a similar pullback in oil prices but that remains a short-term item in a bigger picture, longer-term story.
USD/JPY Daily Chart with Correlation to WTI Oil Futures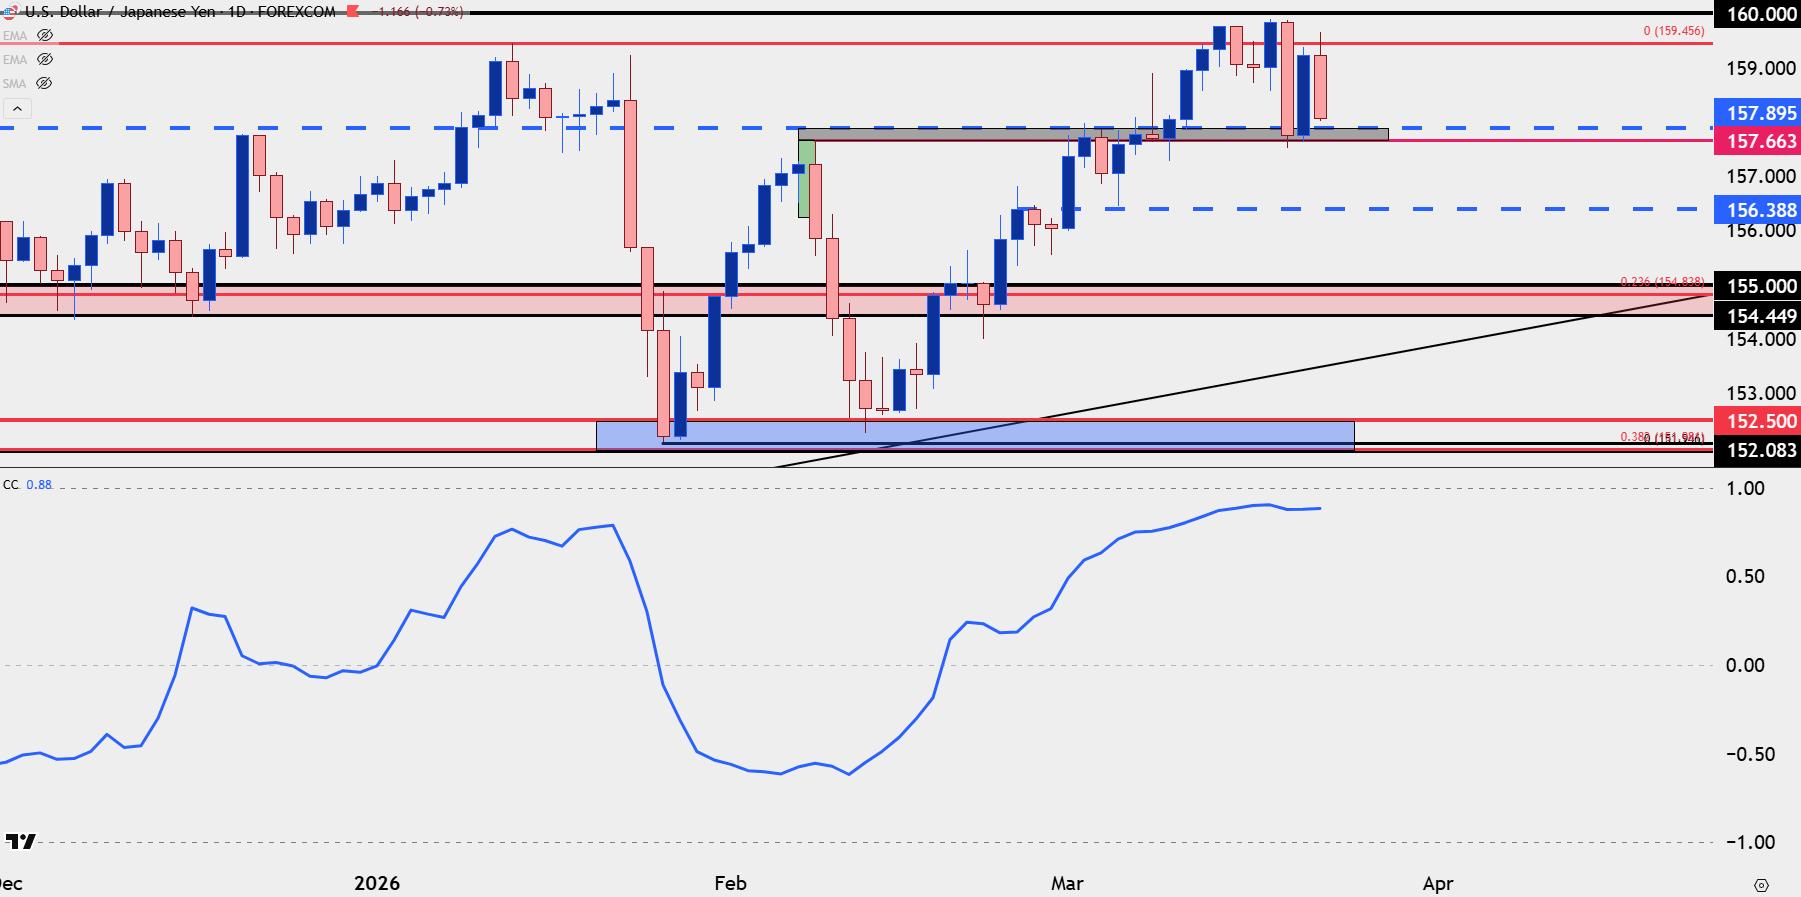
Chart prepared by James Stanley; data derived from Tradingview
USD/JPY The Intervention Threat
The 160.00 level isn’t ‘new’ as a resistance item in USD/JPY nor is the concept of intervention.
In general, currency pairs follow the flow of rates and the swap or rollover on a pair illustrates why. With higher rates in the US than Japan longs can earn swap by holding through rollover, so think of it like a near daily dividend. Shorts, on the other hand, have to pay rollover as they’re long the low yielder and short the high yielder. So longs are incentivized to hold while shorts are dis-incentivized, and this can show up in the trajectory of a trend.
This can also lead to crowded trades, and there’s consequences as the trend-side drive brings more speculators into the matter which leads to further currency imbalance, and this is what gets the focus from Japanese policymakers.
To start this week there were some pointed comments from Japan’s top currency diplomat, Atsushi Mimura, who said that “there are some views that speculative activity in the crude oil futures market is spilling over into the foreign exchange market,” then going on to say “the government is fully prepared to respond at all times on all fronts, keeping in mind that the impact that exchange-rate movements have on people’s lives and the economy.”
This can be implied as a threat that the Bank of Japan may be ordered to intervene should USD/JPY finally perch above that 160.00 level that was defended twice back in 2024, with the second example leading to a 2,000+ pip reversal.
Interestingly, however, the timing of these comments didn’t seem to unnerve USD/JPY bulls all too much, as the pair simply hovered around resistance of 159.50 until putting in a more concerted fall around the start of the US day, which coincides with a drop in oil prices on the back of Trump’s walking back of threats on Iranian energy production.
USD/JPY Four-Hour Price Chart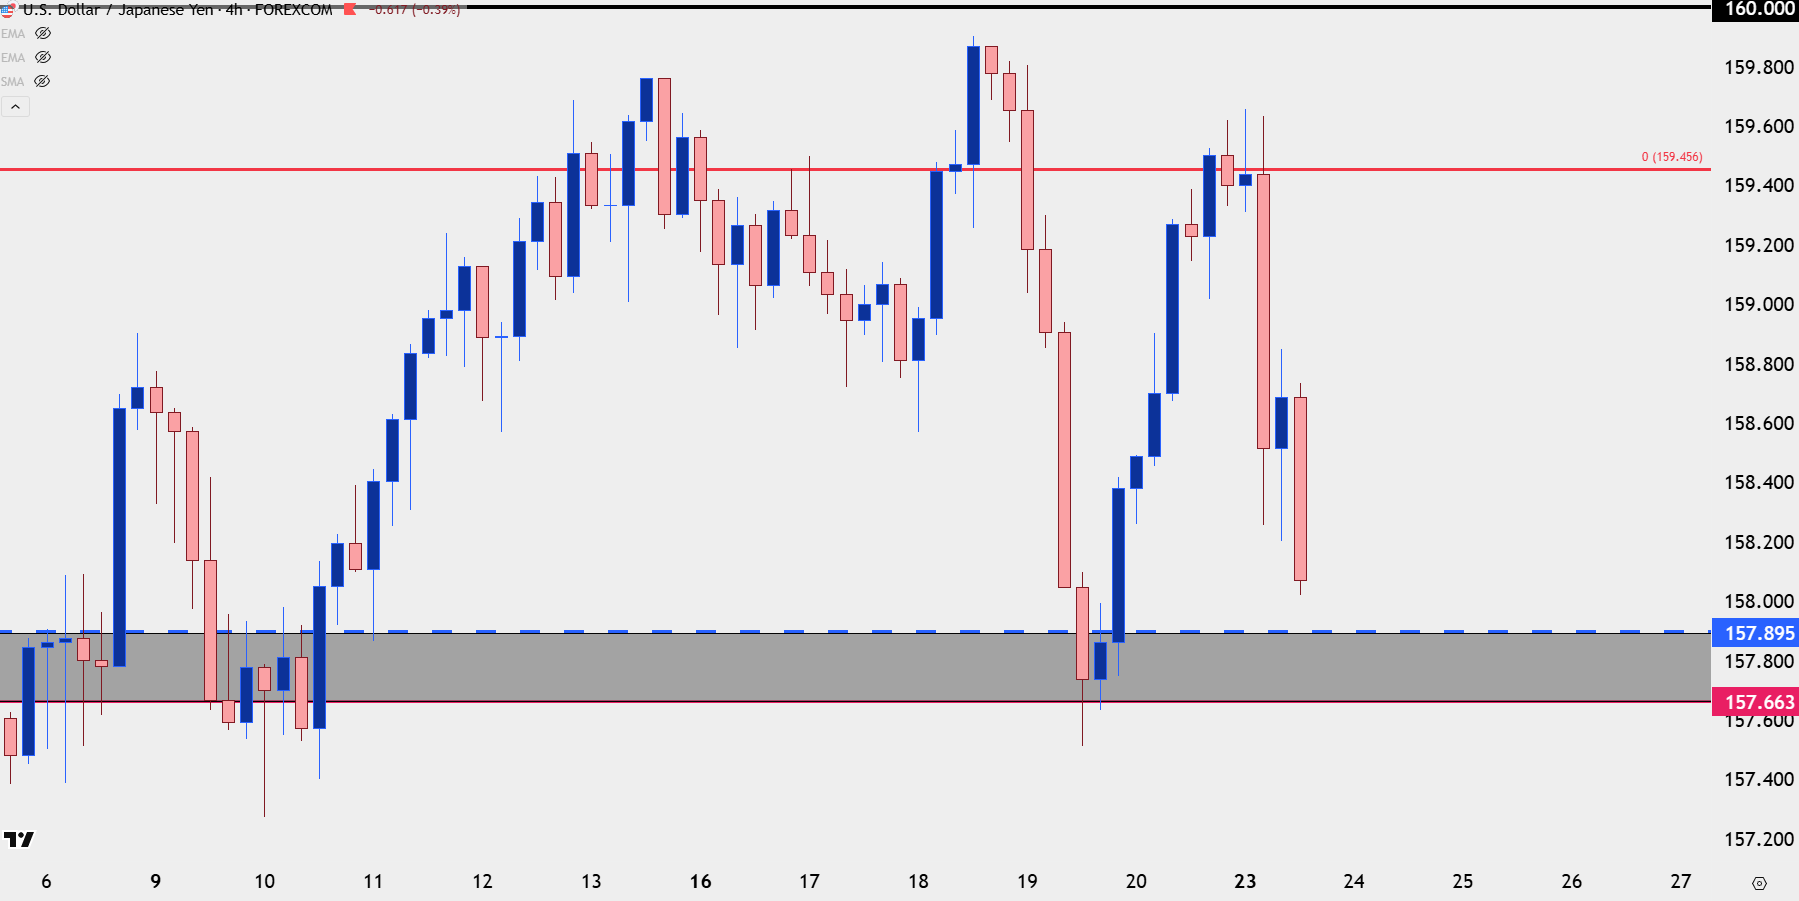
Chart prepared by James Stanley; data derived from Tradingview
EUR/JPY Bull Pennant
While USD/JPY is certainly driving Yen-flows there’s a formation in EUR/JPY worth taking note of, and that’s the bull pennant formation.
For this to play through to a bullish breakout it would seem that we would need some caution from market participants on chasing USD/JPY above 160.00 to the point that we don’t quite cross that line, which could drive the Bank of Japan into action. If we do get the intervention push, it’s difficult to imagine that USD/JPY would avoid getting hit hard which could then drive Yen-strength even against the Euro and or British Pound. But if we strike that happy medium where EUR/USD retains a tinge of mean reversion with an upwards bias, the backdrop for EUR/JPY remains attractive for bullish breakout or continuation scenarios.
EUR/JPY Daily Price Chart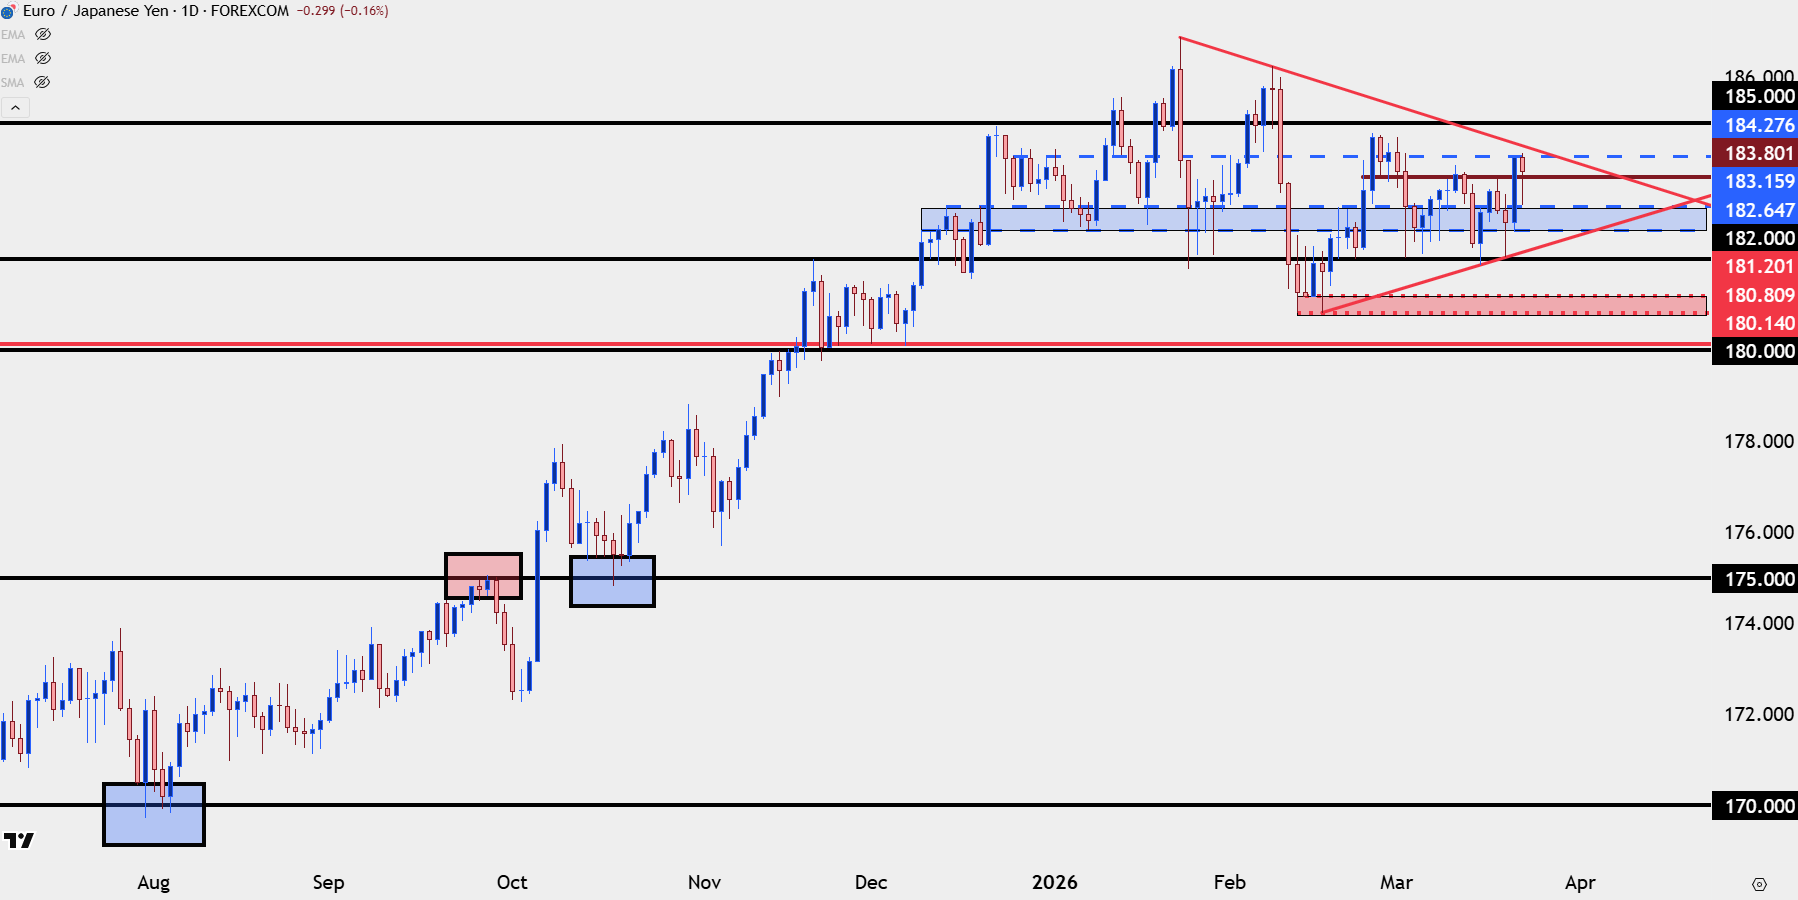
Chart prepared by James Stanley; data derived from Tradingview
GBP/JPY
While EUR/JPY is holding on to a bull pennant formation, GBP/JPY is showing an ascending triangle. I last looked at the pair a couple of weeks ago, and since then, bullish structure has continued to price in even with the dramatic events elsewhere. The support zone around the 208 level held the lows in February, and so far in March, higher-lows developed in the 209.62-210.06 zone. And now we have a second test at the 213.31 level that held the highs just a couple of days after that prior article.
For breakouts, there’s a big level about 100 pips higher but it was the 215.00 level that remained rigid in February when buyers had full control over the trend.
GBP/JPY Daily Price Chart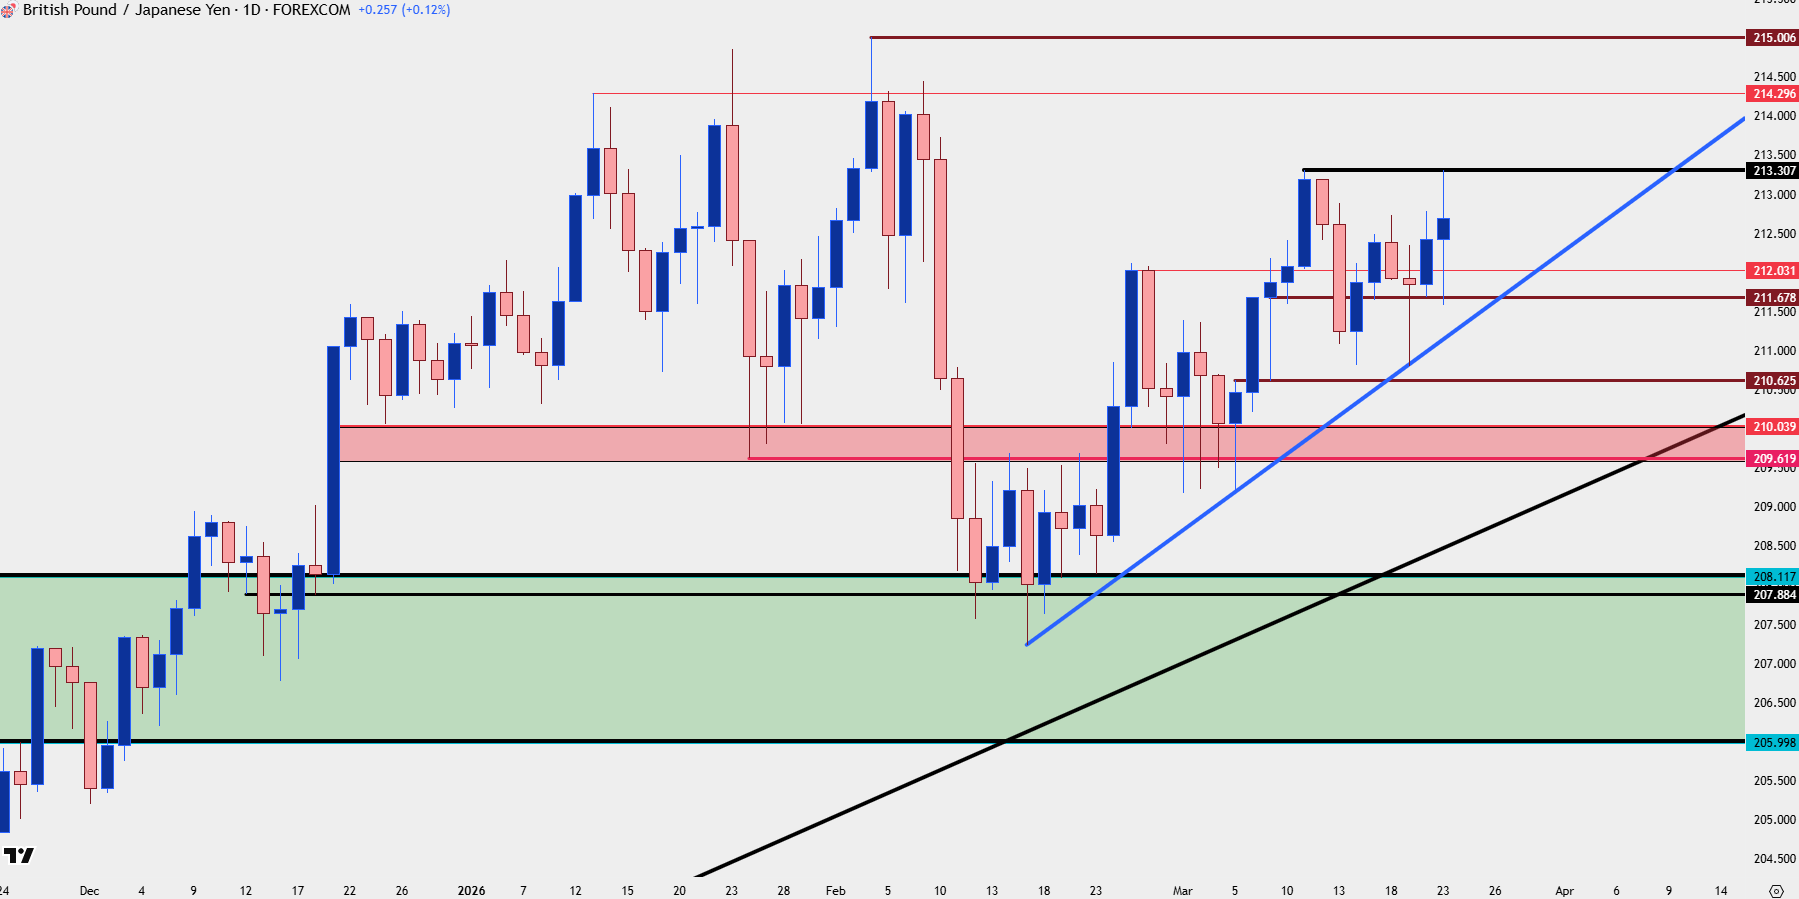
Chart prepared by James Stanley; data derived from Tradingview
--- written by James Stanley, Senior Market Analyst, Global Macro
Related tags:
Latest market news




Open an account in minutes
Experience award-winning platforms with fast and secure execution, and enjoy tight spreads from 0.5 pts on FX and 0.3 pts on indices.
Economic calendar
Web Trader platform
Our sophisticated web-based platform is packed with features.
Related articles
US Dollar Bears Lose Their Grip Ahead of NFP, USD/JPY Vols Elevated
US dollar selling pressure fades ahead of NFP as Fed hike bets retreat. USD/JPY stands out with a 141-pip implied move as FX volatility takes centre stage.

NFP Preview: New Government, Same Jobs Market?
Traders are still sifting through the fallout of the US midterm elections, just in time to get hit with another volatility: The monthly Non-Farm Payrolls (NFP) report - what will the jobs report show, and what could it mean for the US dollar?


US dollar outlook: Nasdaq breakdown raises stakes for EUR/USD, USD/JPY
A potential Democratic sweep of Congress is adding to the AI trade's headaches, with Nasdaq 100 futures breaking below a major technical level. The implications for the dollar could be significant.
This report is intended for general circulation only. It should not be construed as a recommendation, or an offer (or solicitation of an offer) to buy or sell any financial products. The information provided does not take into account your specific investment objectives, financial situation or particular needs. Before you act on any recommendation that may be contained in this report, independent advice ought to be sought from a financial adviser regarding the suitability of the investment product, taking into account your specific investment objectives, financial situation or particular needs.
StoneX Financial Pte. Ltd., may distribute reports produced by its respective foreign entities or affiliates within the StoneX group of companies or third parties pursuant to an arrangement under Regulation 32C of the Financial Advisers Regulations. Where the report is distributed to a person in Singapore who is not an accredited investor, expert investor or an institutional investor (as defined in the Securities Futures Act), StoneX Financial Pte. Ltd. accepts legal responsibility to such persons for the contents of the report only to the extent required by law. Singapore recipients should contact StoneX Financial Pte. Ltd. at 6826 9988 for matters arising from, or in connection with the report.
In the case of all other recipients of this report, to the extent permitted by applicable laws and regulations neither StoneX Financial Pte. Ltd. nor its associated companies will be responsible or liable for any loss or damage incurred arising out of, or in connection with, any use of the information contained in this report and all such liability is hereby expressly disclaimed. No representation or warranty is made, express or implied, that the content of this report is complete or accurate.
StoneX Financial Pte. Ltd. is not under any obligation to update this report.
Trading CFDs carries a high level of risk that may not be suitable for some investors. Consider your investment objectives, level of experience, financial resources, risk appetite and other relevant circumstances carefully. The possibility exists that you could lose some or all of your investments, including your initial deposits. If in doubt, please seek independent expert advice. Visit www.forex.com/en-sg/terms-and-policies for the complete Risk Disclosure Statement.