





USD/CAD Rally Unravels to Pull RSI Back from Overbought Zone
USD/CAD may continue to trade to fresh weekly lows as the RSI falls back from overbought territory.
Share this:

Canadian Dollar Outlook: USD/CAD
USD/CAD extends the series of lower highs and lows from the start of the week as Canada’s Consumer Price Index (CPI) prints at 2.0% in October versus forecasts for a 1.9% reading, with the recent decline in the exchange rate pulling the Relative Strength Index (RSI) below 70.
USD/CAD Rally Unravels to Pull RSI Back from Overbought Zone
USD/CAD trades to a fresh weekly low (1.3951) as the uptick in Canada’s CPI curbs speculation for another Bank of Canada (BoE) rate-cut, and the central bank may move to the sidelines at its last meeting for 2024 as ‘the timing and pace of further reductions in the policy rate will be guided by incoming information and our assessment of its implications for the inflation outlook.’
Join David Song for the Weekly Fundamental Market Outlook webinar. David provides a market overview and takes questions in real-time. Register Here
In turn, USD/CAD may continue to give back the advance from the monthly low (1.3821) should the bearish price action persist, and Canada’s Retail Sales report may fuel the recent weakness in the exchange rate as the update is anticipated to show an ongoing expansion in household consumption.
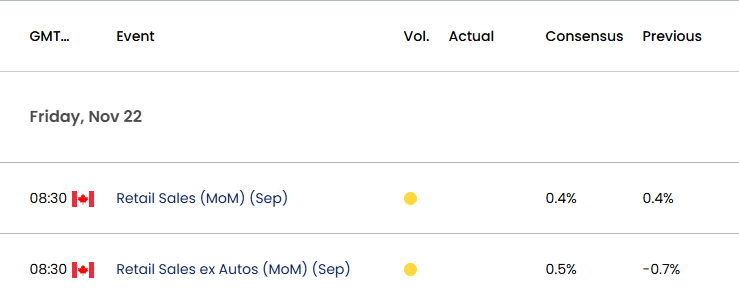
Canada Economic Calendar
Canada Retail Sales are projected to increase another 0.4% in September, and a positive development may generate a bullish reaction in the Canadian Dollar as it encourages the BoC to pause its rate-cutting cycle.
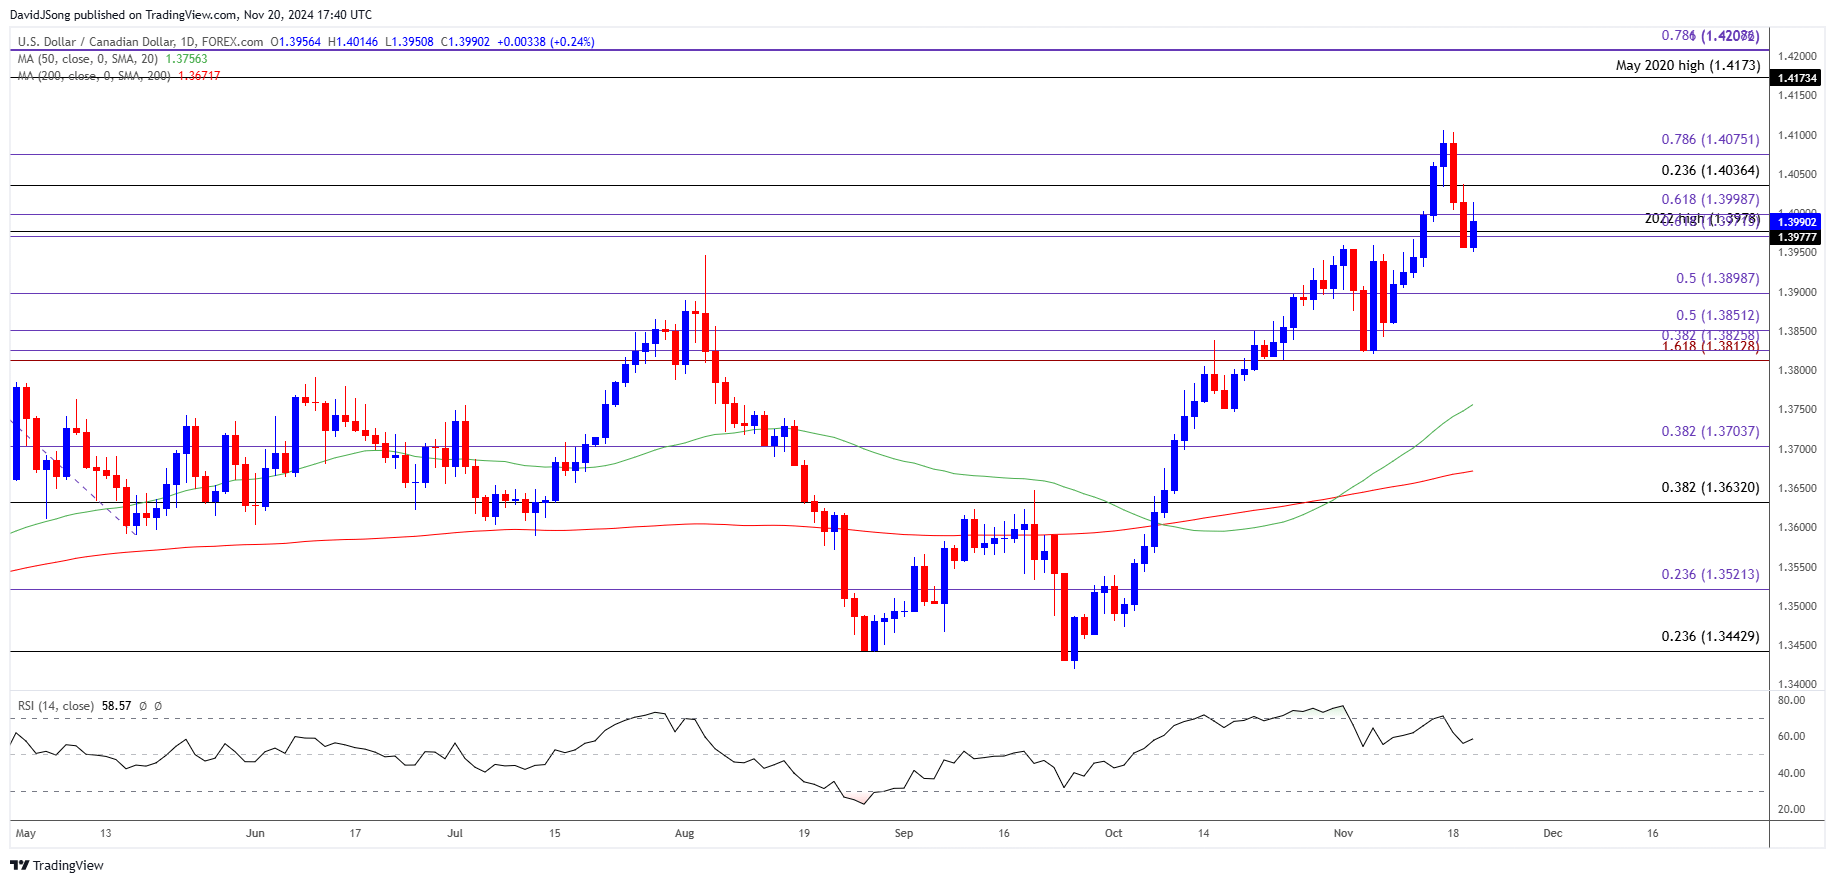
With that said, USD/CAD may continue to trade to fresh weekly lows as the RSI falls back from overbought territory, but the exchange rate may attempt to retrace the decline from the monthly high (1.4106) should it break out of the bearish price series.
USD/CAD Price Chart – Daily
Chart Prepared by David Song, Strategist; USD/CAD Price on TradingView
- USD/CAD may continue to carve a series of lower highs and lows as it struggles to hold above the 1.3970 (61.8% Fibonacci extension) to 1.4000 (61.8% Fibonacci extension) region, with a breach below 1.3900 (50% Fibonacci extension) raising the scope for a move towards the monthly low (1.3821).
- A break/close below the 1.3810 (161.8% Fibonacci extension) to 1.3850 (50% Fibonacci extension) area opens up 1.3700 (50% Fibonacci extension) but the recent pullback in USD/CAD may end up short-lived should it defend the weekly low (1.3951).
- Need a move above the 1.4040 (23.6% Fibonacci retracement) to 1.4080 (78.6% Fibonacci extension) zone for USD/CAD to clear the bearish price series, with a breach above the monthly high (1.4106) opening up the May 2020 high (1.4173).
Additional Market Outlooks
GBP/USD Struggles as BoE Bailey Sees Faster Disinflation
Gold Price Recovery Keeps RSI Above Oversold Zone
US Dollar Forecast: EUR/USD Rebound Pulls RSI Out of Oversold Zone
USD/JPY Rebounds as BoJ Ueda Pledges to Support Economic Activity
--- Written by David Song, Senior Strategist
Follow on Twitter at @DavidJSong
Related tags:
Latest market news




Open an account in minutes
Experience award-winning platforms with fast and secure execution, and enjoy tight spreads from 0.5 pts on FX and 0.3 pts on indices.
Economic calendar
Web Trader platform
Our sophisticated web-based platform is packed with features.
Related articles
Gold forecast: XAU/USD stabilised after recent falls – for now
Gold has started the first week of the new month trying to recover some ground after another bruising week. Oil prices have taken a sharp drop and that has allowed risk assets to bounce back, which has clearly helped the precious metal too. However, with sentiment remaining bearish towards the metals, and with $4000 level having been taken out last week, the path of least resistance is to the downside for gold.


GBP/USD outlook: Currency Pair of the Week | November 2, 2026
The GBP/USD heads into a crowded week of event risk, with the midterm elections, a Bank of England rate decision and Friday's non-farm payrolls report all capable of moving markets sharply. The greenback remains fundamentally well supported by a hawkish Federal Reserve, but much of that is already priced in, while the renewed sell-off in technology stocks has exposed its vulnerability.

Forex, Gold and Oil Outlook: FX Crosses May Have the Edge
Major forex pairs lack conviction, but FX crosses may offer better opportunities. Matt Simpson examines forex, gold and crude oil markets.

This report is intended for general circulation only. It should not be construed as a recommendation, or an offer (or solicitation of an offer) to buy or sell any financial products. The information provided does not take into account your specific investment objectives, financial situation or particular needs. Before you act on any recommendation that may be contained in this report, independent advice ought to be sought from a financial adviser regarding the suitability of the investment product, taking into account your specific investment objectives, financial situation or particular needs.
StoneX Financial Pte. Ltd., may distribute reports produced by its respective foreign entities or affiliates within the StoneX group of companies or third parties pursuant to an arrangement under Regulation 32C of the Financial Advisers Regulations. Where the report is distributed to a person in Singapore who is not an accredited investor, expert investor or an institutional investor (as defined in the Securities Futures Act), StoneX Financial Pte. Ltd. accepts legal responsibility to such persons for the contents of the report only to the extent required by law. Singapore recipients should contact StoneX Financial Pte. Ltd. at 6826 9988 for matters arising from, or in connection with the report.
In the case of all other recipients of this report, to the extent permitted by applicable laws and regulations neither StoneX Financial Pte. Ltd. nor its associated companies will be responsible or liable for any loss or damage incurred arising out of, or in connection with, any use of the information contained in this report and all such liability is hereby expressly disclaimed. No representation or warranty is made, express or implied, that the content of this report is complete or accurate.
StoneX Financial Pte. Ltd. is not under any obligation to update this report.
Trading CFDs carries a high level of risk that may not be suitable for some investors. Consider your investment objectives, level of experience, financial resources, risk appetite and other relevant circumstances carefully. The possibility exists that you could lose some or all of your investments, including your initial deposits. If in doubt, please seek independent expert advice. Visit www.forex.com/en-sg/terms-and-policies for the complete Risk Disclosure Statement.