



USD/RUB back to pre-invasion levels; watch USD/PLN and USD/HUF
Eastern European EM pairs may be a good alternative to USD/RUB for the short-term trader.
Share this:

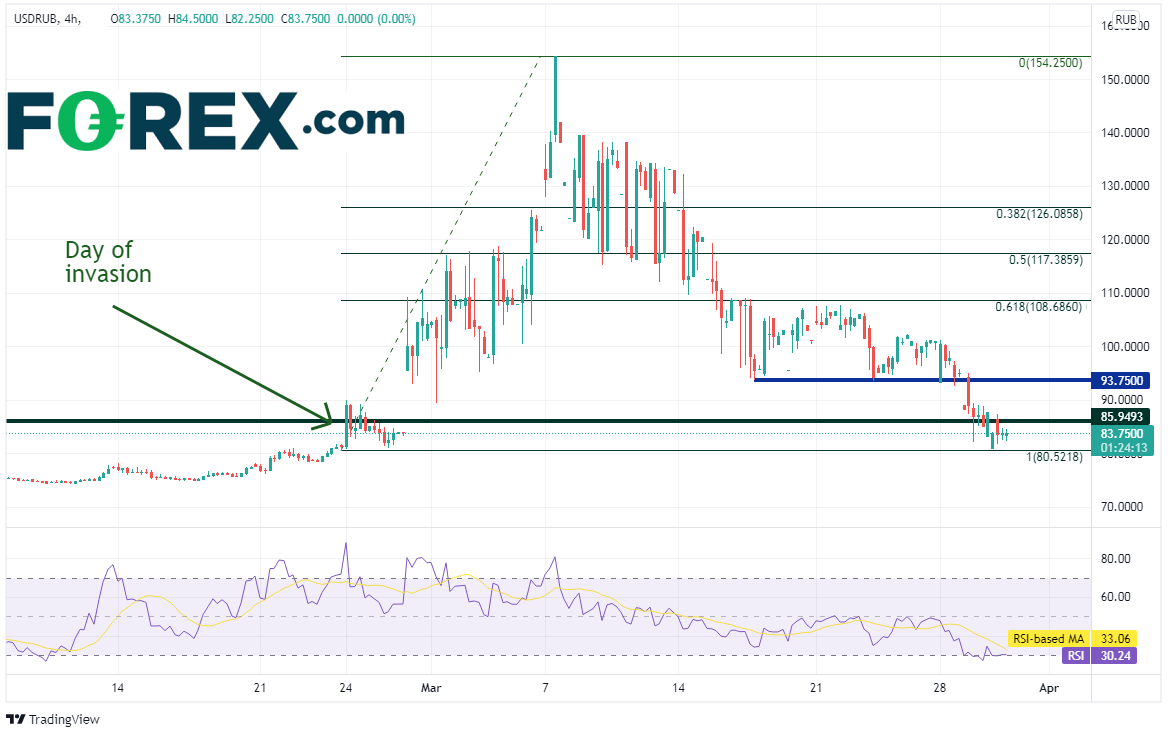
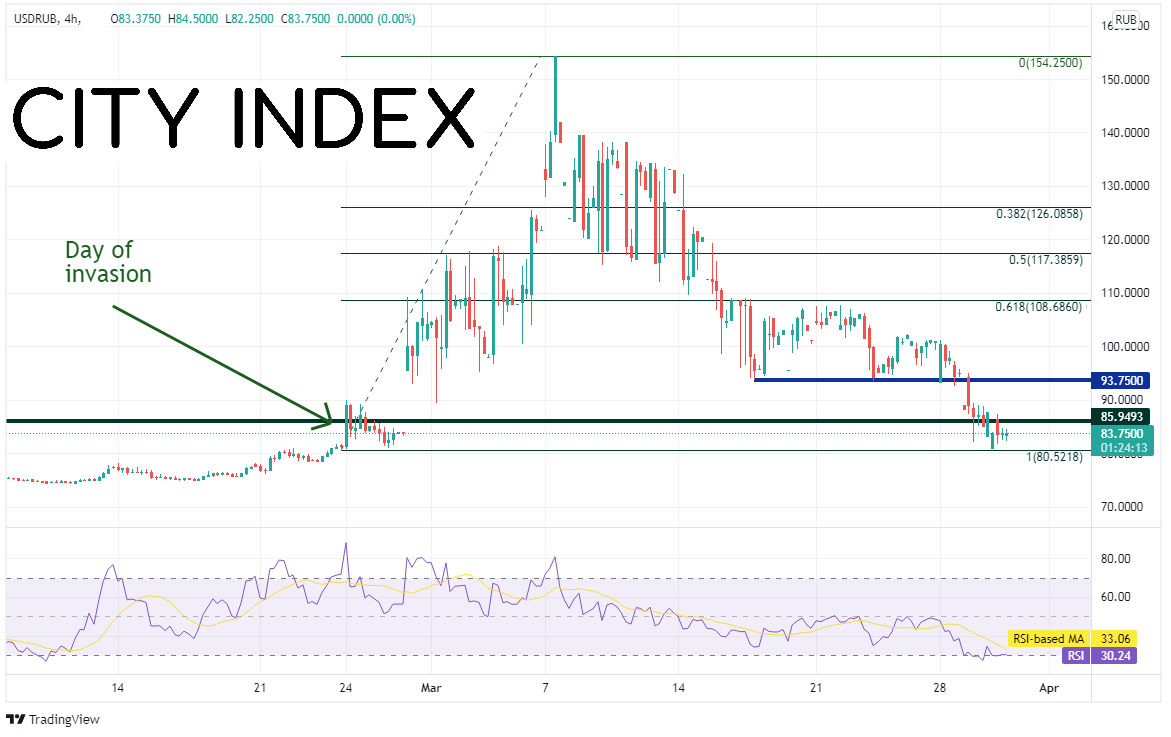
Yesterday, Ukraine President Zelensky said that if a security guarantee system works out, then Ukraine would agree to neutral status and would not have foreign military bases within its borders. In addition, Russia said that Ukraine can still join the EU, just not NATO. As a result of the positive talks, Russia agreed to pullback their military operations near Kyiv. There has also been talk of paying Rubles for natural gas that Germany receives from Russia. Although this was immediately rejected by Germany, Russia is still trying to negotiate a path towards a payment in Rubles. As a result of the positive talks between the two sides regarding the war, along with the possibility of receiving payment in Rubles for gas, USD/RUB has moved lower and is back towards levels not seen since before the invasion date.
Source: Tradingview, Stone X
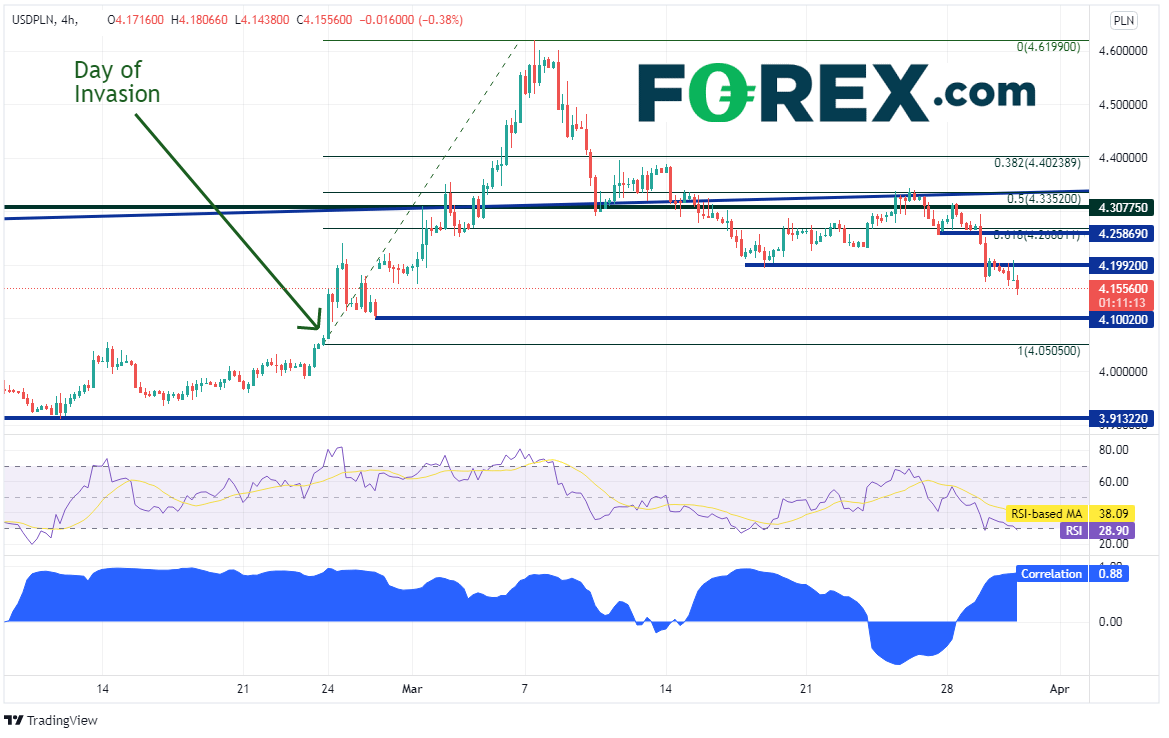
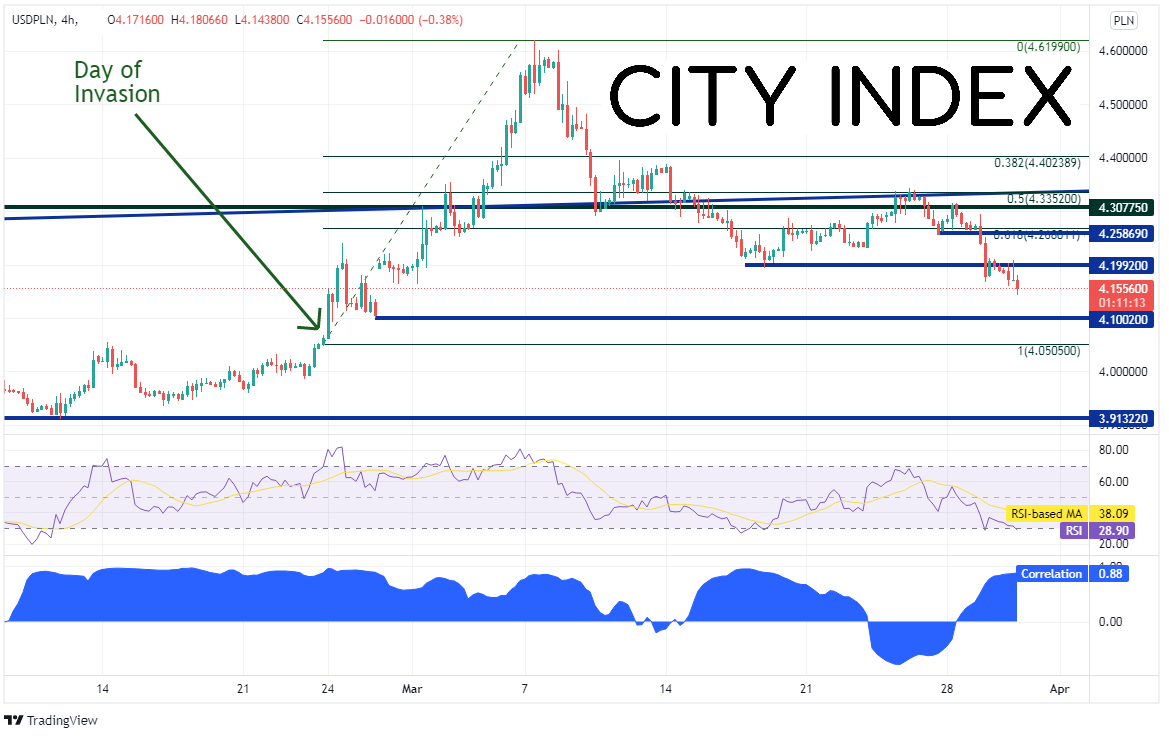
As we had discussed earlier in March, USD/RUB had a high correlation to some of the Eastern European Emerging Market currency pairs, such as the USD/PLN and USD/HUF. On a shorter, 240-minute timeframe, the correlation between USD/RUB and USD/PLN has been in and out of favor for the last 2 weeks. However, the current correlation coefficient between the 2 pairs is +0.88. A correlation of +1.00 means there is a perfect positive correlation and that the 2 pairs move in the same direction 100% of the time. Any reading above +0.80 is considered strong. USD/PLN hasn’t quite reached the breakout point on the day of the invasion at 4.0505. Horizontal support between the breakout level and current levels is at 4.1002. However, notice that the RSI has moved into oversold territory (below 30.00), an indication that USD/PLN may be ready to bounce. Resistance sits above at today’s highs near 4.2020, then horizontal resistance at 4.2587. Above there, resistance is at the previous all-time high (before the war) at 4.3078.
Source: Tradingview, Stone X
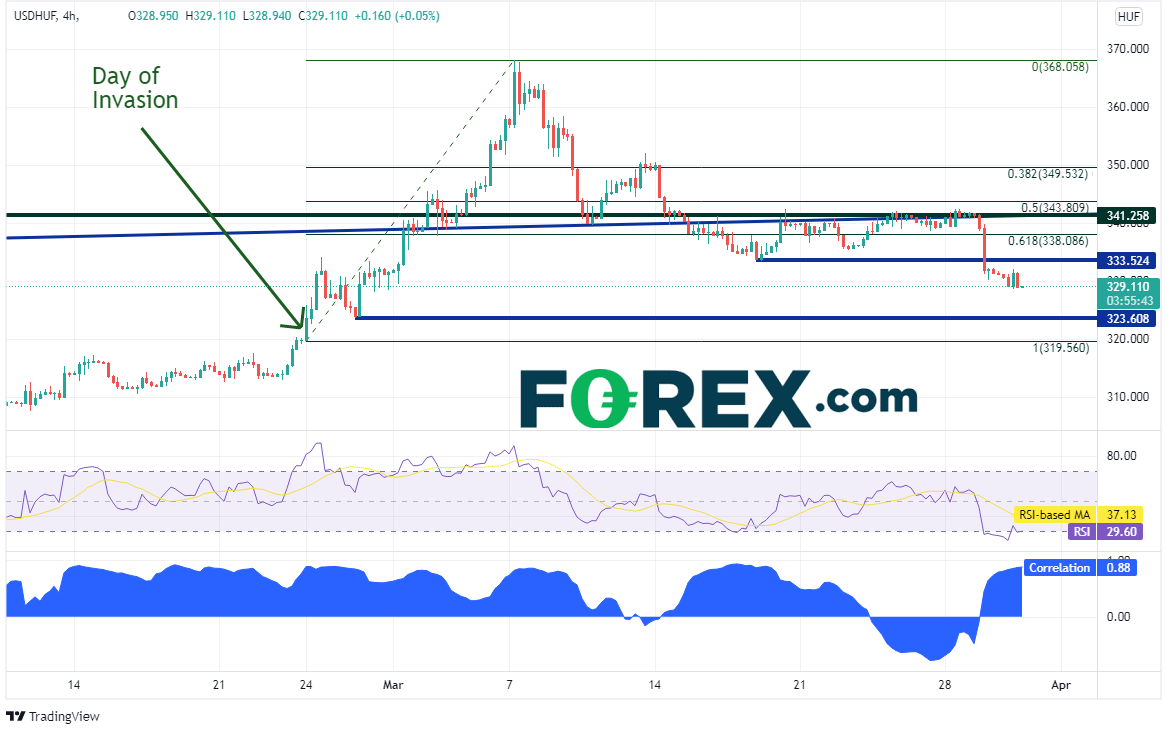
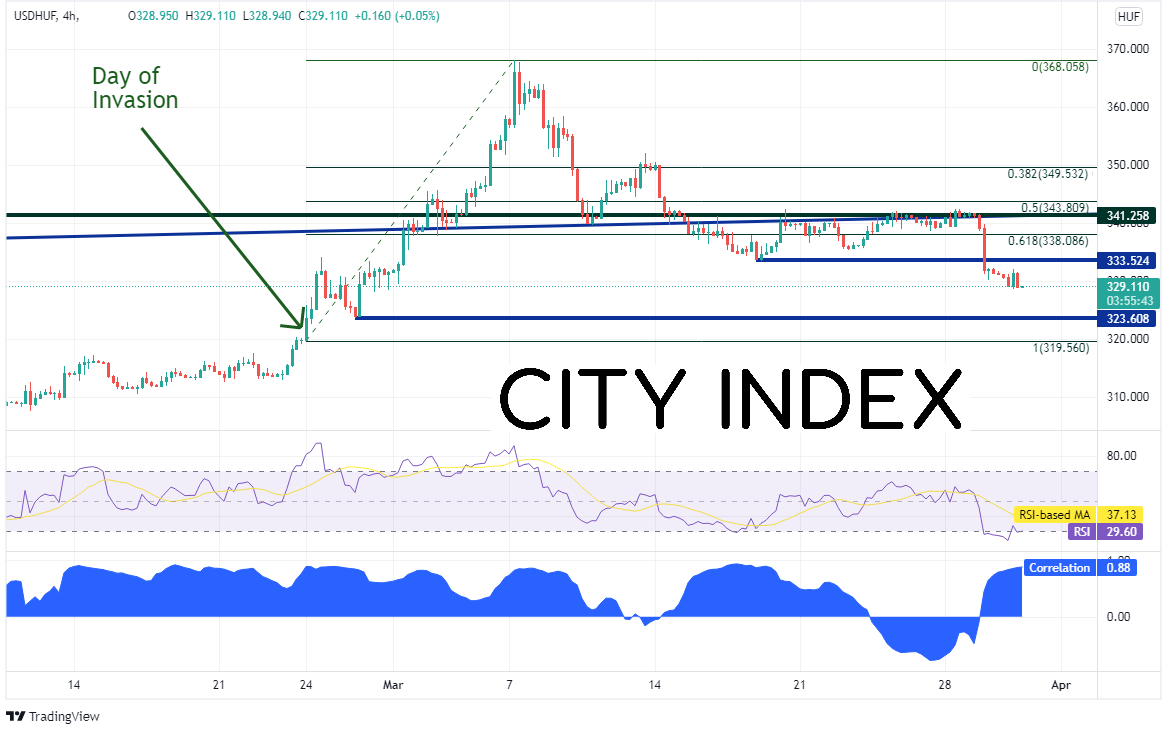
The chart of USD/HUF is similar to that of USD/PLN. On the 240-minute timeframe, USD/HUF and USD/RUB currently have a correlation coefficient of +0.88. In addition, USD/HUF has also pulled back towards the breakout point from before the invasion, however, it still has room to go. Horizontal support sits at 323.608, just above the breakout point on February 24th at 319.56. Notice that the RSI has just moved into oversold territory. Therefore, the pair may be ready for a bounce. Horizontal resistance sits above at 333.52. The next resistance level is the previous all-time high (before the war) at 341.258.
Source: Tradingview, Stone X
USD/RUB is back to levels not seen since the start of the war. However, its EM partners still have room to return to their breakout points. On the shorter 240-minute timeframe, the correlation is strong. Therefore, if one doesn’t have access to trade USD/RUB, the Eastern European EMs may be a good alternative for the short-term trader.
Yesterday, Ukraine President Zelensky said that if a security guarantee system works out, then Ukraine would agree to neutral status and would not have foreign military bases within its borders. In addition, Russia said that Ukraine can still join the EU, just not NATO. As a result of the positive talks, Russia agreed to pullback their military operations near Kyiv. There has also been talk of paying Rubles for natural gas that Germany receives from Russia. Although this was immediately rejected by Germany, Russia is still trying to negotiate a path towards a payment in Rubles. As a result of the positive talks between the two sides regarding the war, along with the possibility of receiving payment in Rubles for gas, USD/RUB has moved lower and is back towards levels not seen since before the invasion date.
Source: Tradingview, Stone X
As we had discussed earlier in March, USD/RUB had a high correlation to some of the Eastern European Emerging Market currency pairs, such as the USD/PLN and USD/HUF. On a shorter, 240-minute timeframe, the correlation between USD/RUB and USD/PLN has been in and out of favor for the last 2 weeks. However, the current correlation coefficient between the 2 pairs is +0.88. A correlation of +1.00 means there is a perfect positive correlation and that the 2 pairs move in the same direction 100% of the time. Any reading above +0.80 is considered strong. USD/PLN hasn’t quite reached the breakout point on the day of the invasion at 4.0505. Horizontal support between the breakout level and current levels is at 4.1002. However, notice that the RSI has moved into oversold territory (below 30.00), an indication that USD/PLN may be ready to bounce. Resistance sits above at today’s highs near 4.2020, then horizontal resistance at 4.2587. Above there, resistance is at the previous all-time high (before the war) at 4.3078.
Source: Tradingview, Stone X
Trade USD/PLN now: Login or Open a new account!
• Open an account in the UK
• Open an account in Australia
• Open an account in Singapore
The chart of USD/HUF is similar to that of USD/PLN. On the 240-minute timeframe, USD/HUF and USD/RUB currently have a correlation coefficient of +0.88. In addition, USD/HUF has also pulled back towards the breakout point from before the invasion, however, it still has room to go. Horizontal support sits at 323.608, just above the breakout point on February 24th at 319.56. Notice that the RSI has just moved into oversold territory. Therefore, the pair may be ready for a bounce. Horizontal resistance sits above at 333.52. The next resistance level is the previous all-time high (before the war) at 341.258.
Source: Tradingview, Stone X
Trade USD/HUF now: Login or Open a new account!
• Open an account in the UK
• Open an account in Australia
• Open an account in Singapore
USD/RUB is back to levels not seen since the start of the war. However, its EM partners still have room to return to their breakout points. On the shorter 240-minute timeframe, the correlation is strong. Therefore, if one doesn’t have access to trade USD/RUB, the Eastern European EMs may be a good alternative for the short-term trader.
Learn more about forex trading opportunities.
Related tags:
Latest market news



Open an account in minutes
Experience award-winning platforms with fast and secure execution, and enjoy tight spreads from 0.5 pts on FX and 0.3 pts on indices.
Economic calendar
Web Trader platform
Our sophisticated web-based platform is packed with features.
Related articles
AUD, NZD, CAD: Commodity FX Faces a 24-Hour Central Bank Storm
Australian CPI and rate decisions from the RBNZ, BoC and Fed put AUD, NZD and CAD to the test, with inflation surprises and policy guidance in focus.

FOMC Meeting Preview: Is Warsh Even Capable of Delivering a Hawkish Hold?
Fed Funds futures traders are pricing in ~90% odds that the FOMC leaves rates unchanged this week, but the big question is whether FOMC Chairman Warsh can deliver a true hawkish hike.

Japanese Yen Forecast: USD/JPY Seven-Week Resistance Standoff Faces Fed, BoJ 10 27 2026
A rebound from yearly-open support has revived the USD/JPY recovery, but bulls still need a decisive weekly close to unlock further upside.

This report is intended for general circulation only. It should not be construed as a recommendation, or an offer (or solicitation of an offer) to buy or sell any financial products. The information provided does not take into account your specific investment objectives, financial situation or particular needs. Before you act on any recommendation that may be contained in this report, independent advice ought to be sought from a financial adviser regarding the suitability of the investment product, taking into account your specific investment objectives, financial situation or particular needs.
StoneX Financial Pte. Ltd., may distribute reports produced by its respective foreign entities or affiliates within the StoneX group of companies or third parties pursuant to an arrangement under Regulation 32C of the Financial Advisers Regulations. Where the report is distributed to a person in Singapore who is not an accredited investor, expert investor or an institutional investor (as defined in the Securities Futures Act), StoneX Financial Pte. Ltd. accepts legal responsibility to such persons for the contents of the report only to the extent required by law. Singapore recipients should contact StoneX Financial Pte. Ltd. at 6826 9988 for matters arising from, or in connection with the report.
In the case of all other recipients of this report, to the extent permitted by applicable laws and regulations neither StoneX Financial Pte. Ltd. nor its associated companies will be responsible or liable for any loss or damage incurred arising out of, or in connection with, any use of the information contained in this report and all such liability is hereby expressly disclaimed. No representation or warranty is made, express or implied, that the content of this report is complete or accurate.
StoneX Financial Pte. Ltd. is not under any obligation to update this report.
Trading CFDs carries a high level of risk that may not be suitable for some investors. Consider your investment objectives, level of experience, financial resources, risk appetite and other relevant circumstances carefully. The possibility exists that you could lose some or all of your investments, including your initial deposits. If in doubt, please seek independent expert advice. Visit www.forex.com/en-sg/terms-and-policies for the complete Risk Disclosure Statement.