





Using the RSI to Trade in Ranges EURUSD
The RSI can be a powerful tool when used in combination with other technical tools
Share this:

With the plethora of tape bombs over the last few days and weeks regarding the on-again/off-again negotiations regarding both Brexit and the US fiscal stimulus package, traders have become somewhat immune. It seems that no longer do comments such as “walking away from the table”, “close to a deal”, and “ready to put pen to paper” matter. Until something is actually done, in writing, will the markets pay attention. Some of this can be seen in the price action of the EUR/USD over the last few months.
EUR/USD
Tradingview, City Index
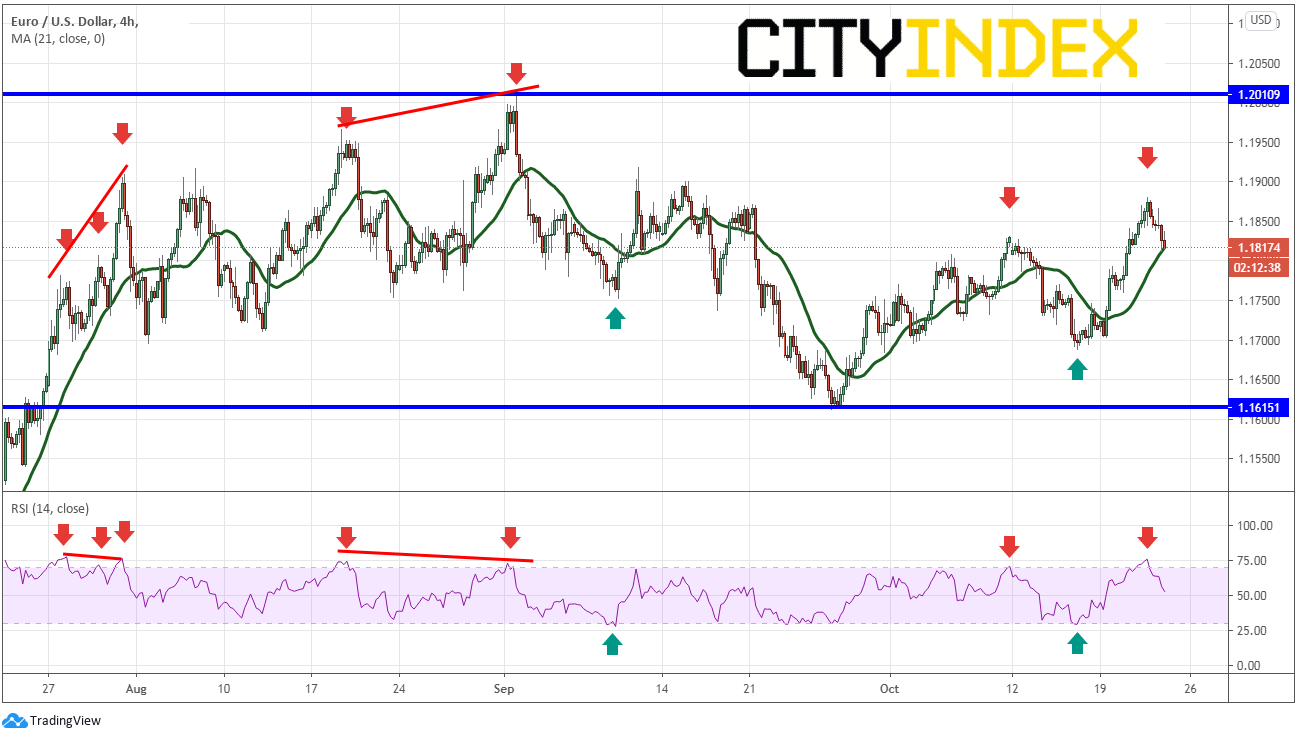
From the end of July until today, a 240-minute EUR/USD chart shows that the pair has been trading in roughly a range of 400 pips between 1.1615 and 1.2010. RSI indicators, in combination with other technical tools, can be used to look for spots to enter a trade. The RSI moves on a scale between the range of 0-100. When the line moves above 70, the RSI indicator is considered overbought, and sellers may soon take control. When the line moves below 30, the RSI indicator is considered oversold, and buyers may soon take control. The arrows in the above example show where the RSI moved into overbought or oversold conditions, and price soon reversed direction.
All oscillators should never be used alone. This is true for the RSI as well. There is potential for overbought to become overbought”er” and oversold to become oversold”er”. It is best to use them in combination with other technical indicators. When there is a confluence of indicators, traders will have more confidence to enter a trade. Trendlines, support and resistance, moving averages and divergence can be used as criteria to both enter and exit trades.
As an example, on July 31st:
Tradingview, City Index
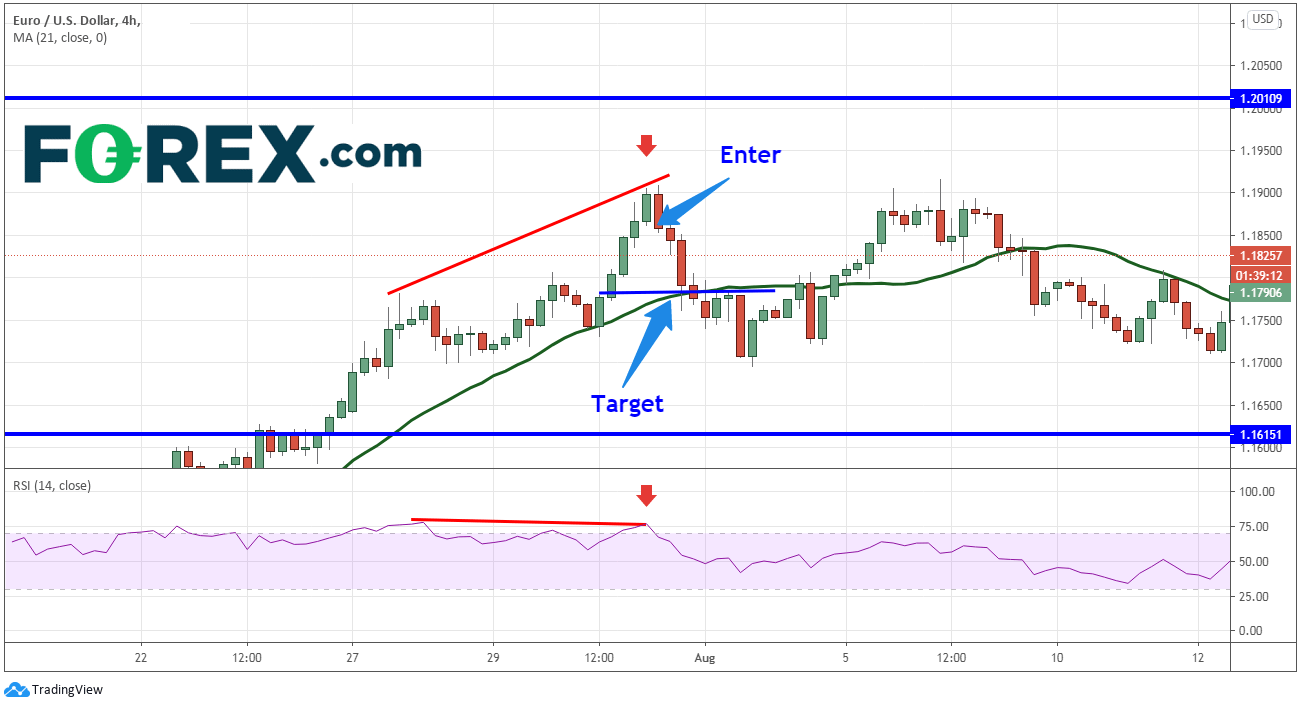
1) The RSI moved into overbought territory and….
2) The RSI is diverging price. EUR/USD now moves onto the radar.
3) Price is just above 1.1900 (psychological round number resistance).
4) The next 240-minute candle is a bearish engulfing candle.
If one were to enter a short EUR/USD trade at the close of the bearish engulfing candle, 1.1858, a target could be the 21-Day Moving Average near 1.1775, which also near horizontal support. 2 candles later, price hit the target and the RSI was back in neutral territory.
The RSI can be a powerful tool when used in combination with other technical tools, especially in trading ranges. Along with proper risk/management, the RSI can help traders make better decisions.
With the plethora of tape bombs over the last few days and weeks regarding the on-again/off-again negotiations regarding both Brexit and the US fiscal stimulus package, traders have become somewhat immune. It seems that no longer do comments such as “walking away from the table”, “close to a deal”, and “ready to put pen to paper” matter. Until something is actually done, in writing, will the markets pay attention. Some of this can be seen in the price action of the EUR/USD over the last few months.
EUR/USD
Tradingview, FOREX.com
From the end of July until today, a 240-minute EUR/USD chart shows that the pair has been trading in roughly a range of 400 pips between 1.1615 and 1.2010. RSI indicators, in combination with other technical tools, can be used to look for spots to enter a trade. The RSI moves on a scale between the range of 0-100. When the line moves above 70, the RSI indicator is considered overbought, and sellers may soon take control. When the line moves below 30, the RSI indicator is considered oversold, and buyers may soon take control. The arrows in the above example show where the RSI moved into overbought or oversold conditions, and price soon reversed direction.
All oscillators should never be used alone. This is true for the RSI as well. There is potential for overbought to become overbought”er” and oversold to become oversold”er”. It is best to use them in combination with other technical indicators. When there is a confluence of indicators, traders will have more confidence to enter a trade. Trendlines, support and resistance, moving averages and divergence can be used as criteria to both enter and exit trades.
As an example, on July 31st:
Tradingview, FOREX.com
1) The RSI moved into overbought territory and….
2) The RSI is diverging price. EUR/USD now moves onto the radar.
3) Price is just above 1.1900 (psychological round number resistance).
4) The next 240-minute candle is a bearish engulfing candle.
If one were to enter a short EUR/USD trade at the close of the bearish engulfing candle, 1.1858, a target could be the 21-Day Moving Average near 1.1775, which also near horizontal support. 2 candles later, price hit the target and the RSI was back in neutral territory.
The RSI can be a powerful tool when used in combination with other technical tools, especially in trading ranges. Along with proper risk/management, the RSI can help traders make better decisions.
Latest market news




Open an account in minutes
Experience award-winning platforms with fast and secure execution, and enjoy tight spreads from 0.5 pts on FX and 0.3 pts on indices.
Economic calendar
Web Trader platform
Our sophisticated web-based platform is packed with features.
Related articles
USD/JPY Weekly Outlook: Volatility Has Left the Building
The yen has ignored broad dollar weakness, falling Treasury yields and renewed market turbulence. Yet its relationship with US interest rates remains intact. So why is USD/JPY going absolutely nowhere fast?
Swiss Franc Forecast: USD/CHF Seven-Week Rally Reverses From Yearly Highs 10 16 2026
A sharp rejection from fresh highs has shifted momentum in favor of USD/CHF bears, raising the stakes for a critical support test.


AUD/USD Bulls Fight Back After Australian Jobs Shock
AUD/USD has been hit by another ugly Australian employment report, sending RBA rate hike expectations sharply lower. Yet the relationships driving the currency have shifted since quarter-end, and improving risk appetite could provide the fuel for a recovery.
This report is intended for general circulation only. It should not be construed as a recommendation, or an offer (or solicitation of an offer) to buy or sell any financial products. The information provided does not take into account your specific investment objectives, financial situation or particular needs. Before you act on any recommendation that may be contained in this report, independent advice ought to be sought from a financial adviser regarding the suitability of the investment product, taking into account your specific investment objectives, financial situation or particular needs.
StoneX Financial Pte. Ltd., may distribute reports produced by its respective foreign entities or affiliates within the StoneX group of companies or third parties pursuant to an arrangement under Regulation 32C of the Financial Advisers Regulations. Where the report is distributed to a person in Singapore who is not an accredited investor, expert investor or an institutional investor (as defined in the Securities Futures Act), StoneX Financial Pte. Ltd. accepts legal responsibility to such persons for the contents of the report only to the extent required by law. Singapore recipients should contact StoneX Financial Pte. Ltd. at 6826 9988 for matters arising from, or in connection with the report.
In the case of all other recipients of this report, to the extent permitted by applicable laws and regulations neither StoneX Financial Pte. Ltd. nor its associated companies will be responsible or liable for any loss or damage incurred arising out of, or in connection with, any use of the information contained in this report and all such liability is hereby expressly disclaimed. No representation or warranty is made, express or implied, that the content of this report is complete or accurate.
StoneX Financial Pte. Ltd. is not under any obligation to update this report.
Trading CFDs carries a high level of risk that may not be suitable for some investors. Consider your investment objectives, level of experience, financial resources, risk appetite and other relevant circumstances carefully. The possibility exists that you could lose some or all of your investments, including your initial deposits. If in doubt, please seek independent expert advice. Visit www.forex.com/en-sg/terms-and-policies for the complete Risk Disclosure Statement.