



V-bottom on Hang Seng, Dow Jones to lead the way higher?
We saw a strong finish for global equities last week, and as the Dow Jones was an outperformer during the recent turmoil, we suspect it could outperform during a recovery.
Share this:

We saw quite a reversal of fortunes on Wall Street last week. In last week’s report we noted that US indices were on track for a third bearish month – which would be its first occurrence since March 2020. Yet a strong rebound for equities now sees the Nasdaq 100, S&P 500 and Dow Jones trading slightly higher for the month. With that said, we still have nearly 2-weeks of trade left in the month but it does at least highlight the higher levels of volatility seen these past few weeks.
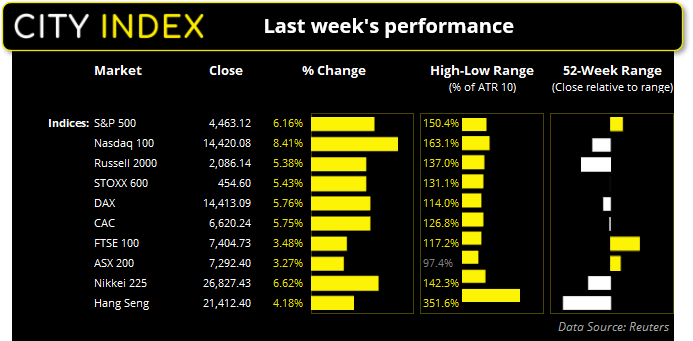
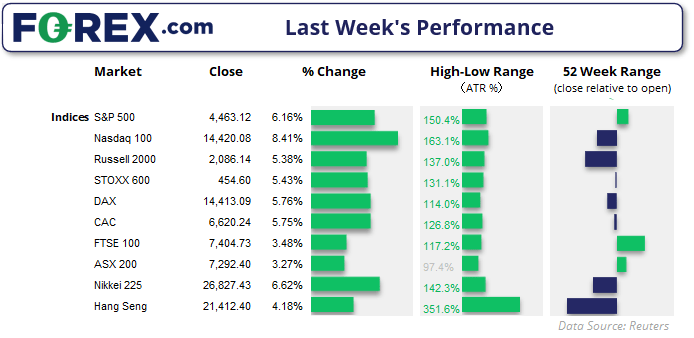
The Nasdaq posted a strong rally from 13,000 and has risen 10% from its low. It will need to break above 15,625 to confirm a technical bull market (+20% gain from its low) and that remains to be seen. But over the near-term we remain bullish o US indices due to strong bullish momentum and increasing trading volumes, after an extended sell-off. As the Dow Jones saw the weakest retracement from its record high, we prefer long setup son the Dow Jones over the near-term.
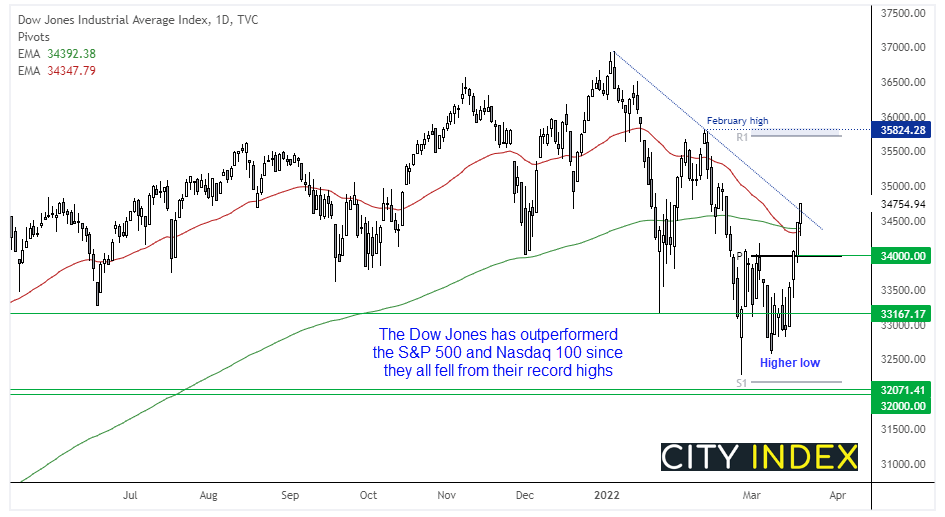
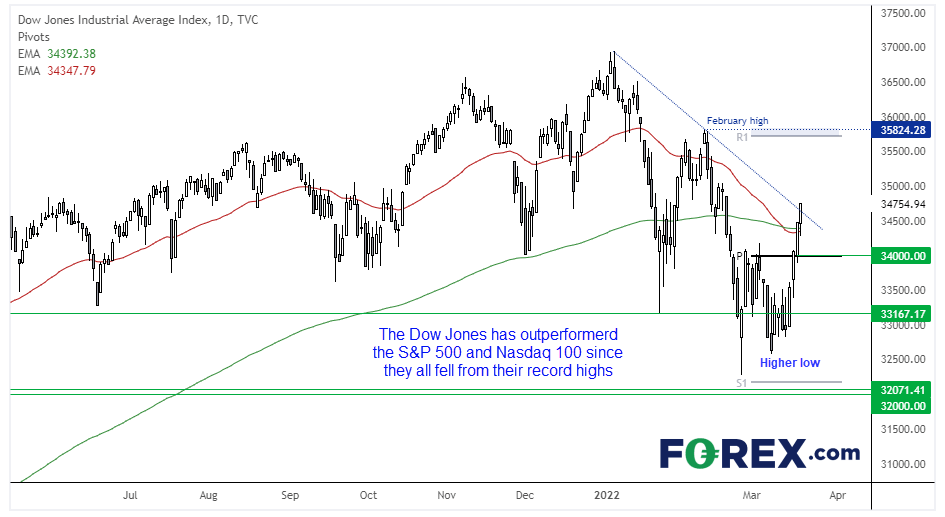
Dow Jones Industrial Average:
The Dow Jones (DJI) has rallied 7.7% from its February low, and printed a higher low in March. The index has closed back above its 200 and 50-day eMA’s and is the only mega-cap index of the three to do so. The monthly pivot sits near the round number of 34,000 so our bias remains bullish above that level over the near-term. We would be interested in dips above this level with an initial target set for 356,000, just below the monthly R1 pivot and February high.
Hang Seng:
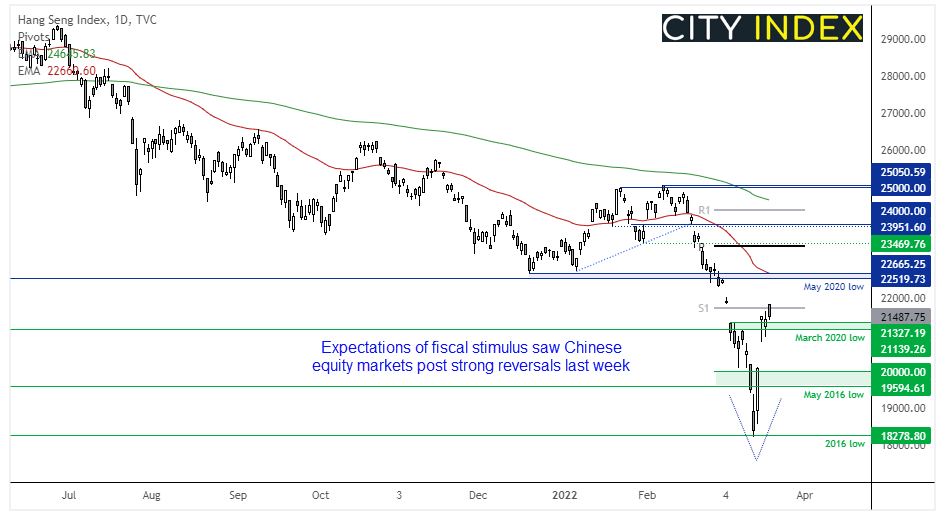
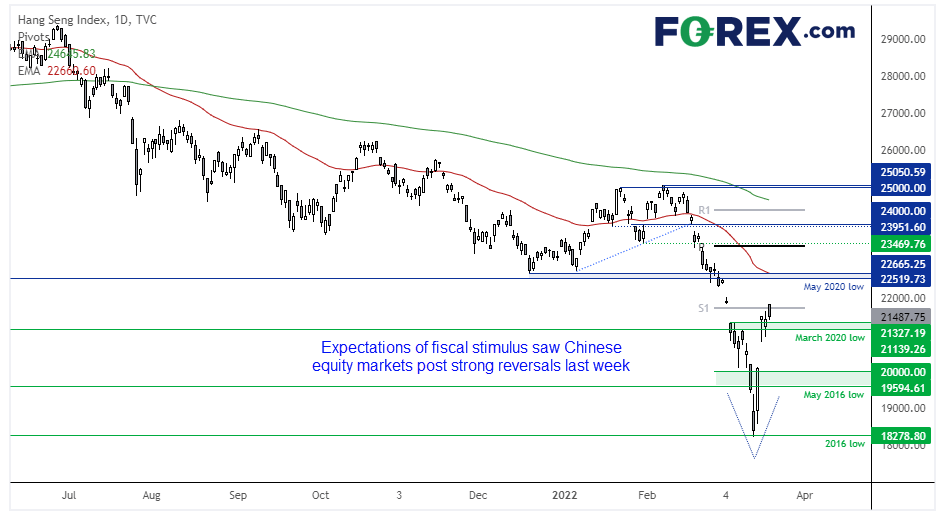
No sooner than we saw prices drop and hit our 18,300 downside target, momentum reversed and marked an important swing low. Promise of further stimulus in China sent local markets sharply higher on Wednesday, then proceeded to track Wall Street for the remainder of the week. And with the reversal being so strong it has left a potential V-bottom pattern, which can sometimes be associated with significant market lows. We now look for the March 2020 low to hold as support and prices head for 22,600, near the May 2020 low.
Nikkei futures positioning (priced in yen):
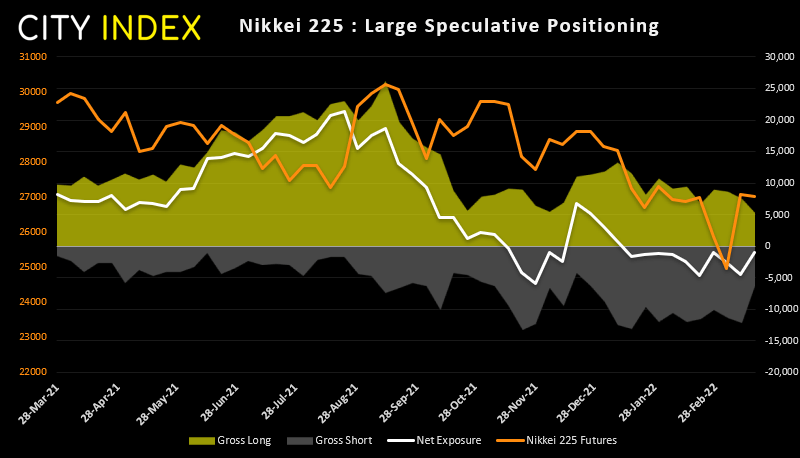
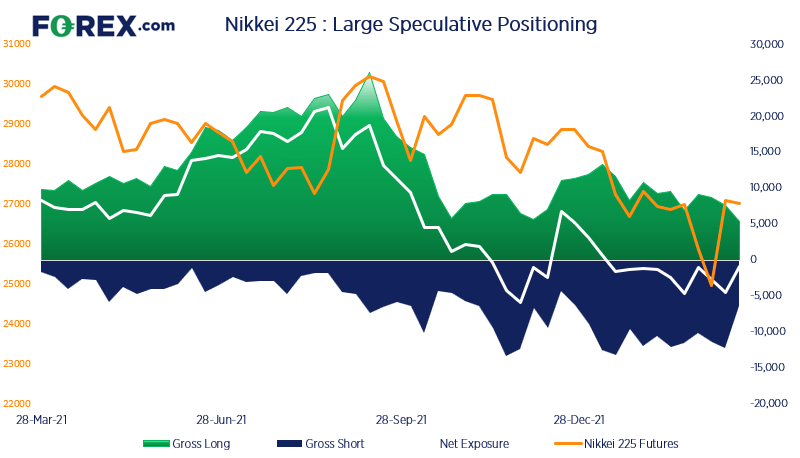
Traders remained net-short Nikkei futures for a tenth consecutive week. Yet their level of bearishness has been reduced to its lowest point since flipping to net-short exposure back in January. 5.8k short contracts were closed, along with -2.3k long contracts which saw net-short exposure reduced by -3.6k contracts.
Nikkei 225 index:
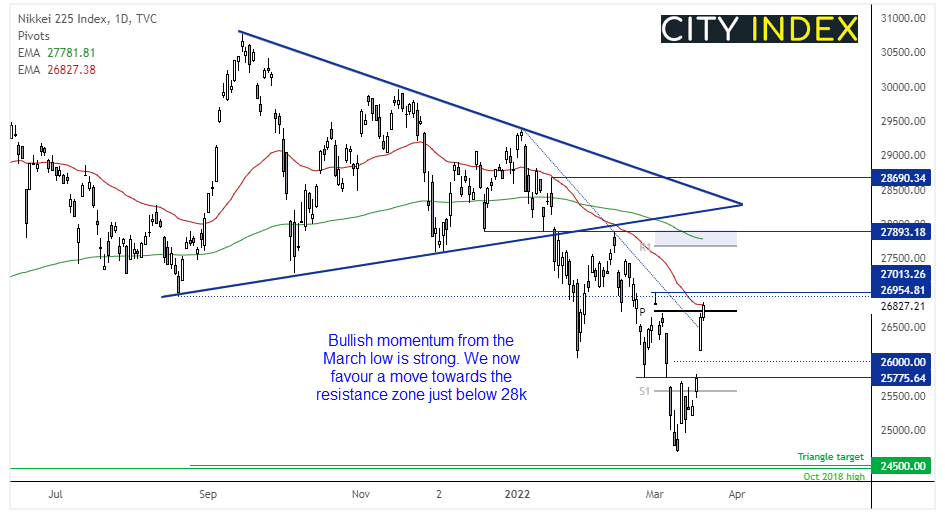
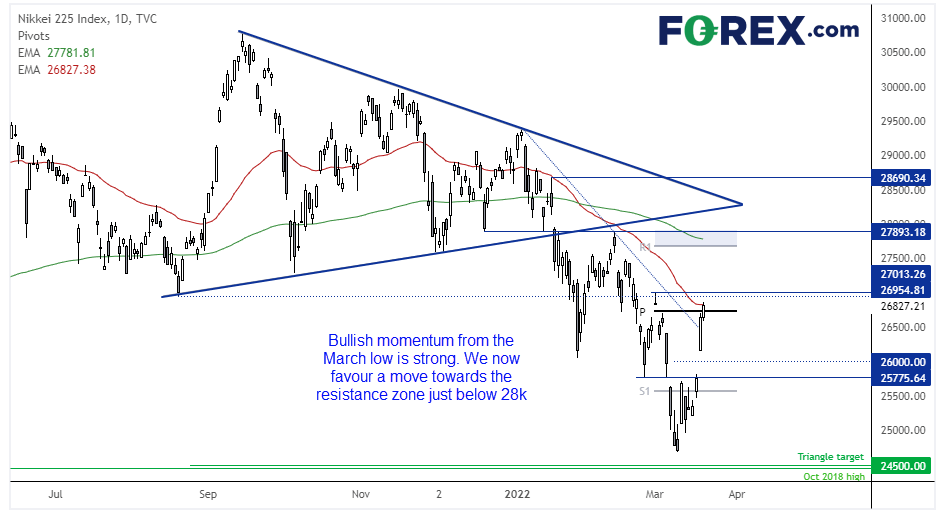
We warned in last week’s report that the Nikkei showed the potential for a countertrend bounce, and that is exactly what we saw with the index rallying 6.6% by Friday’s close. Futures markets have since risen to a 3-week high as sentiment remains positive at the start of the week.
A key level for bulls to conquer (and defend as support) is 27,000, as this would also see the Nikkei trade comfortably above the 50-day eMA. Whilst prices remain above 27,000 we favour a move to the 27,893 high, which is near the 200-day eMA and monthly R1 pivot.
Read our guide on the Nikkei 225 trading guide
Read our guide on the Nikkei 225 trading guide
How to trade with City Index
You can easily trade with City Index by using these four easy steps:
- Open an account, or log in if you’re already a customer
• Open an account in the UK
• Open an account in Australia
• Open an account in Singapore
- Search for the company you want to trade in our award-winning platform
- Choose your position and size, and your stop and limit levels
- Place the trade
How to trade with FOREX.com
Follow these easy steps to start trading with FOREX.com today:
- Open a Forex.com account, or log in if you’re already a customer.
- Search for the pair you want to trade in our award-winning platform.
- Choose your position and size, and your stop and limit levels.
- Place the trade.
Related tags:
Latest market news




Open an account in minutes
Experience award-winning platforms with fast and secure execution, and enjoy tight spreads from 0.5 pts on FX and 0.3 pts on indices.
Economic calendar
Web Trader platform
Our sophisticated web-based platform is packed with features.
Related articles
Euro Technical Forecast: EUR/USD Five-Week Range Puts Yearly Lows on the Line 11 7 2026
Euro support has held, but the bulls have struggled to gain ground as next week's U.S. CPI sets the stage for a potentially decisive EUR/USD breakout.
Gold weekly outlook: XAU/USD holds above $4,000 despite strong US jobs data
Gold has held above $4,000 despite a much stronger-than-expected October jobs report. Fawad Razaqzada explains why lower yields and the tech sell-off have supported the metal, and why next week's US CPI could decide its next move.

Australian Dollar Short-term Outlook: AUD/USD 3% Plunge Puts Multi-Month Range at Risk 11 6 2026
A sharp equity-led selloff has driven AUD/USD toward critical June-low support, with strong NFP data adding pressure ahead of next week’s U.S. CPI.
This report is intended for general circulation only. It should not be construed as a recommendation, or an offer (or solicitation of an offer) to buy or sell any financial products. The information provided does not take into account your specific investment objectives, financial situation or particular needs. Before you act on any recommendation that may be contained in this report, independent advice ought to be sought from a financial adviser regarding the suitability of the investment product, taking into account your specific investment objectives, financial situation or particular needs.
StoneX Financial Pte. Ltd., may distribute reports produced by its respective foreign entities or affiliates within the StoneX group of companies or third parties pursuant to an arrangement under Regulation 32C of the Financial Advisers Regulations. Where the report is distributed to a person in Singapore who is not an accredited investor, expert investor or an institutional investor (as defined in the Securities Futures Act), StoneX Financial Pte. Ltd. accepts legal responsibility to such persons for the contents of the report only to the extent required by law. Singapore recipients should contact StoneX Financial Pte. Ltd. at 6826 9988 for matters arising from, or in connection with the report.
In the case of all other recipients of this report, to the extent permitted by applicable laws and regulations neither StoneX Financial Pte. Ltd. nor its associated companies will be responsible or liable for any loss or damage incurred arising out of, or in connection with, any use of the information contained in this report and all such liability is hereby expressly disclaimed. No representation or warranty is made, express or implied, that the content of this report is complete or accurate.
StoneX Financial Pte. Ltd. is not under any obligation to update this report.
Trading CFDs carries a high level of risk that may not be suitable for some investors. Consider your investment objectives, level of experience, financial resources, risk appetite and other relevant circumstances carefully. The possibility exists that you could lose some or all of your investments, including your initial deposits. If in doubt, please seek independent expert advice. Visit www.forex.com/en-sg/terms-and-policies for the complete Risk Disclosure Statement.