



Why EUR/USD’s near-term bias could flip bearish below 1.0640
While both the ECB and the Fed will be raising interest rates in the latter half of the year, recent headlines suggest that the case for continued growth in the US economy is stronger than in Europe
Share this:
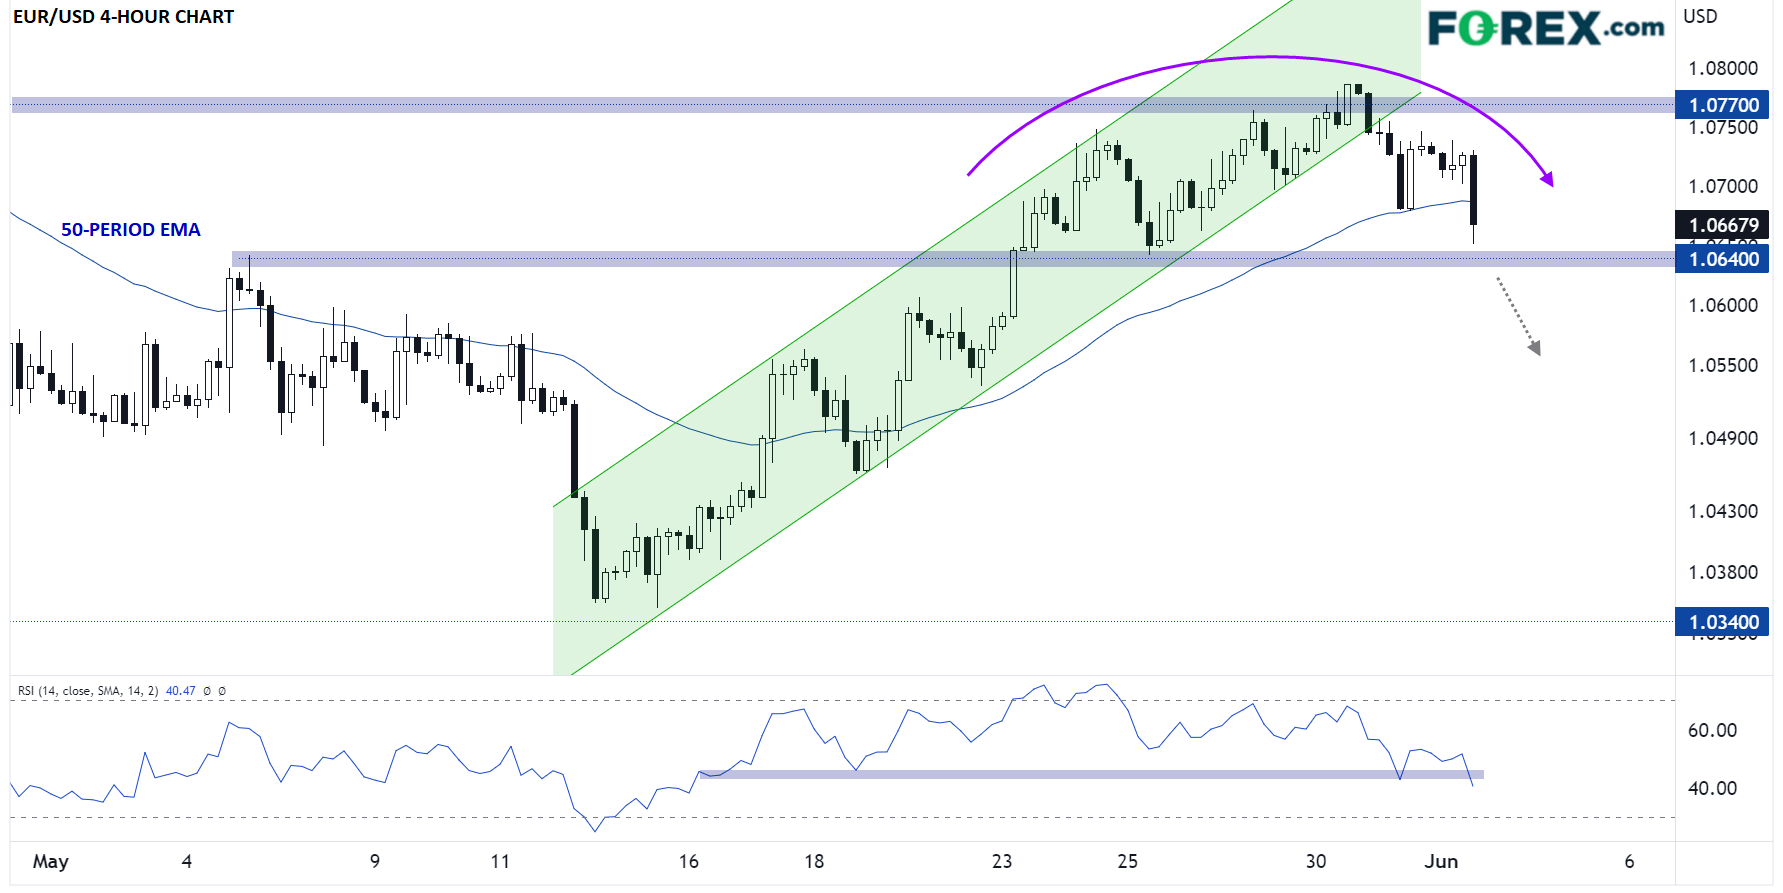
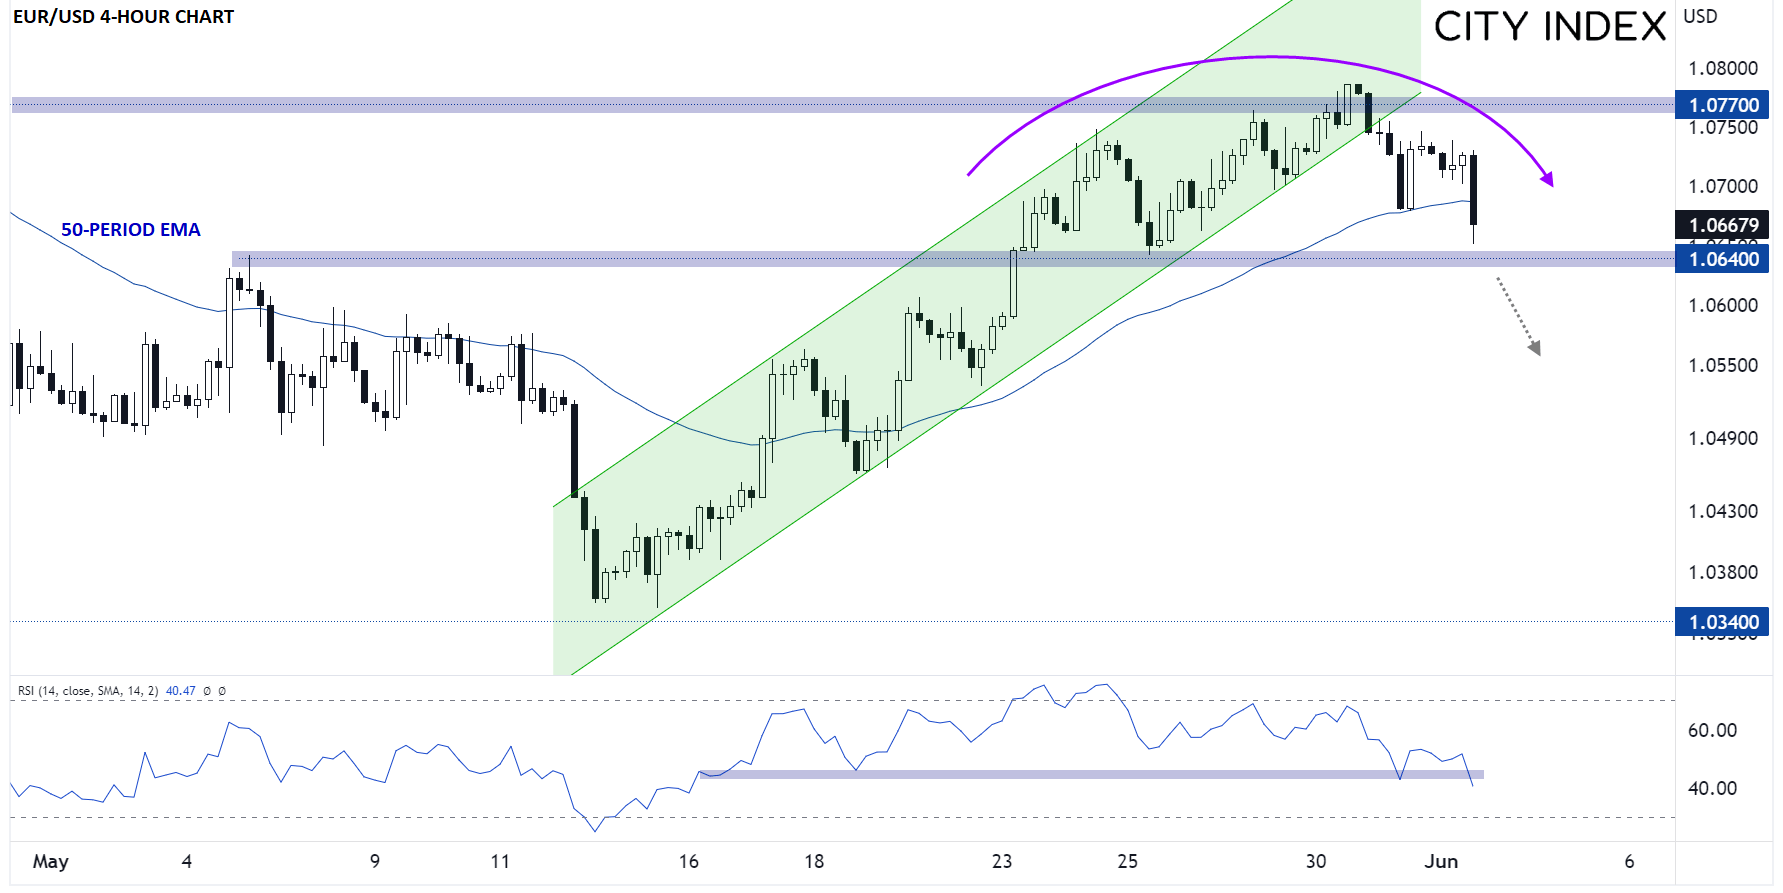
Last week, we noted that that the world’s most widely-traded currency pair was rising within a near-term bullish channel and looking to retest key resistance in the 1.0770 area. As the updated chart below shows, EUR/USD did indeed retest that area, but bulls were unable to muster enough strength to push the pair above it.
Source: StoneX, TradingView
Now, EUR/USD has definitively broken down from that channel and is within about 20 pips of previous-resistance-turned-support in the 1.0640 zone. The idea that former resistance levels, or ceilings on price, can turn into future support levels, or floors under price, once they’re broken (and vice versa) is called the polarity principle, and in this case it suggests that a break back below the 1.0640 level would shift the near-term bias to bearish for a move back down toward 1.0500. Indeed, the pair’s 4-hour RSI indicator has already dropped to its lowest level in more than two weeks, signaling that buying pressure is rapidly dissipating.
From a fundamental perspective, the immediate catalyst for today’s selloff in EUR/USD is better-than-expected economic data out of the US, where both this morning’s ISM Manufacturing PMI report and the JOLTS job openings report came in strong. Meanwhile, the European Union’s decision to ban most Russian oil imports by the end of the year, while principled, may have the short-term effect of slowing economic growth and further entrenching inflation.
In other words, while both the ECB and the Fed will be raising interest rates in the latter half of the year, recent headlines suggest that the case for continued growth in the US economy is stronger than in Europe, and that could keep the greenback on the front foot in the coming days.
How to trade with City Index
You can trade with City Index by following these four easy steps:
- Open an account, or log in if you’re already a customer
• Open an account in the UK
• Open an account in Australia
• Open an account in Singapore
- Search for the market you want to trade in our award-winning platform
- Choose your position and size, and your stop and limit levels
- Place the trade
Related tags:
Latest market news


Open an account in minutes
Experience award-winning platforms with fast and secure execution, and enjoy tight spreads from 0.5 pts on FX and 0.3 pts on indices.
Economic calendar
Web Trader platform
Our sophisticated web-based platform is packed with features.
Related articles
FOMC Meeting Preview: Is Warsh Even Capable of Delivering a Hawkish Hold?
Fed Funds futures traders are pricing in ~90% odds that the FOMC leaves rates unchanged this week, but the big question is whether FOMC Chairman Warsh can deliver a true hawkish hike.
Japanese Yen Forecast: USD/JPY Seven-Week Resistance Standoff Faces Fed, BoJ 10 27 2026
A rebound from yearly-open support has revived the USD/JPY recovery, but bulls still need a decisive weekly close to unlock further upside.


Silver Forecast: Is XAG/USD Finally Finding a Bottom
Silver is showing some encouraging signs after an initially weak start to the session. The metal dropped to a new year-to-date low below the $53 handle, reaching $52.60 before staging a sharp recovery.

This report is intended for general circulation only. It should not be construed as a recommendation, or an offer (or solicitation of an offer) to buy or sell any financial products. The information provided does not take into account your specific investment objectives, financial situation or particular needs. Before you act on any recommendation that may be contained in this report, independent advice ought to be sought from a financial adviser regarding the suitability of the investment product, taking into account your specific investment objectives, financial situation or particular needs.
StoneX Financial Pte. Ltd., may distribute reports produced by its respective foreign entities or affiliates within the StoneX group of companies or third parties pursuant to an arrangement under Regulation 32C of the Financial Advisers Regulations. Where the report is distributed to a person in Singapore who is not an accredited investor, expert investor or an institutional investor (as defined in the Securities Futures Act), StoneX Financial Pte. Ltd. accepts legal responsibility to such persons for the contents of the report only to the extent required by law. Singapore recipients should contact StoneX Financial Pte. Ltd. at 6826 9988 for matters arising from, or in connection with the report.
In the case of all other recipients of this report, to the extent permitted by applicable laws and regulations neither StoneX Financial Pte. Ltd. nor its associated companies will be responsible or liable for any loss or damage incurred arising out of, or in connection with, any use of the information contained in this report and all such liability is hereby expressly disclaimed. No representation or warranty is made, express or implied, that the content of this report is complete or accurate.
StoneX Financial Pte. Ltd. is not under any obligation to update this report.
Trading CFDs carries a high level of risk that may not be suitable for some investors. Consider your investment objectives, level of experience, financial resources, risk appetite and other relevant circumstances carefully. The possibility exists that you could lose some or all of your investments, including your initial deposits. If in doubt, please seek independent expert advice. Visit www.forex.com/en-sg/terms-and-policies for the complete Risk Disclosure Statement.