



WTI crude oil prices defy the bullish consensus
The 4-month winning streak on oil prices is on track to be snapped, with October having erased all of September’s gains. And this flies in the face of current news flows, of the potential for the Middle East conflict to escalate and send oil prices higher (alongside food, energy and inflation expectations).
Share this:

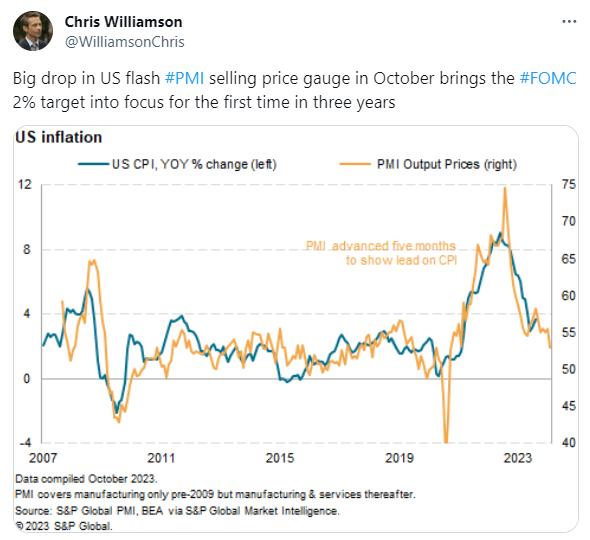
PMI data for the US was better than expected, which helped the US dollar index rally from a key support area on Tuesday and weigh on oil prices. The S&P Global report suggests the economy expanded at its fastest pace in three months with flash composite PMI rise to 51, up from 50.2. Services PMI accounted to the baulk of the rise with its flash PMI rising to 50.9, above 49.8 expected and 50.1 prior.
Whilst this could initially be seen as slightly inflationary which could add pressure on the Fed to hike at least once more, price pressures are easing which could actually lower the need for further hikes. If prices pressures are easing, it could also weigh on headline CPI and inflation expectations. And that could also be bearish for oil prices. And this flies in the face of current news flows, with the potential for the Middle East conflict to escalate and send oil prices higher (alongside food, energy and inflation expectations).
S&P Global’s Chief economist thinks that inflation could reach the Fed’s 2% inflation target “in the coming months” without the economy tipping into contraction. If so, it means inflation pressures are falling faster than anticipated and that the US could avoid a recession. Whilst this is supportive to oil prices to a degree (on the assumption on greater demand than a recession would usually bring), it could also cap upside potential and pour cold water on calls for oil in excess of $100. Assuming World War III is avoided.
S&P Global’s Chief Business Economist “The survey’s selling price gauge is now close to its prepandemic long-run average and consistent with headline inflation dropping close to the Fed’s 2% target in the coming months, something which looks likely to be achieved without output falling into contraction”.
WTI crude oil technical analysis (weekly chart)
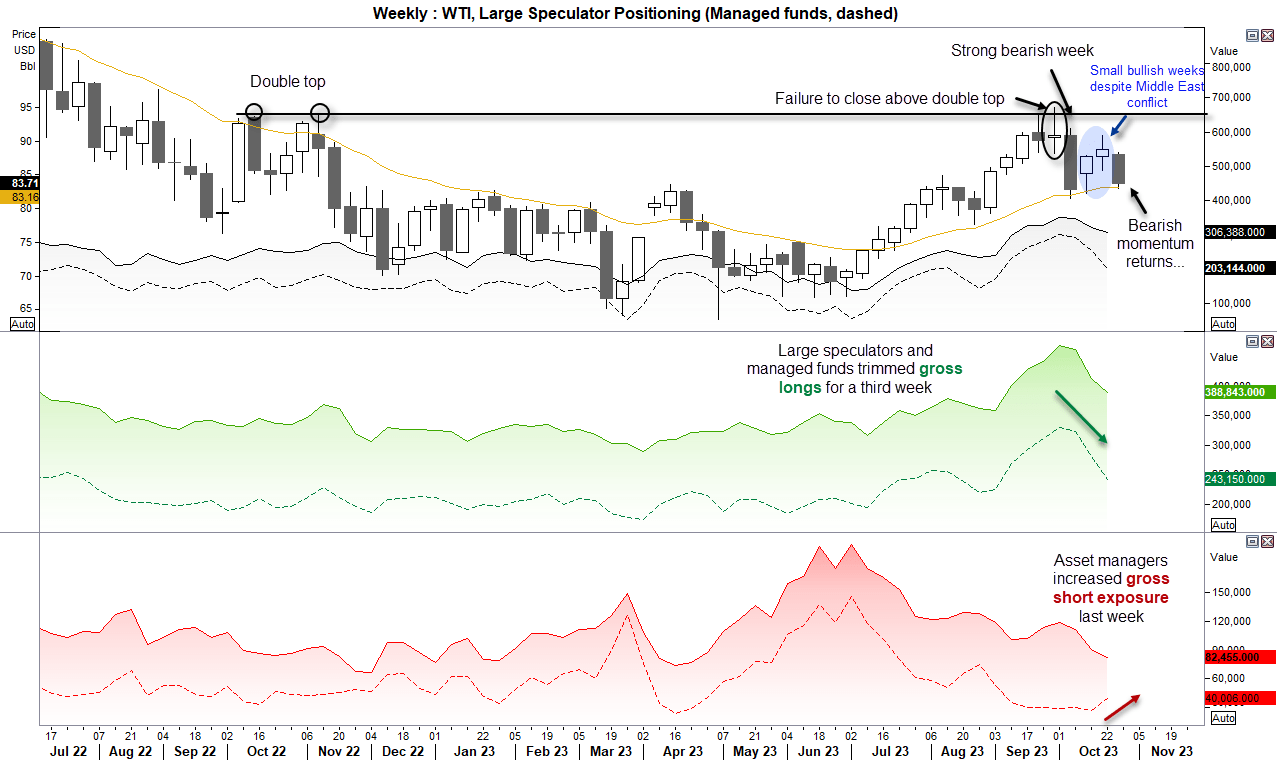
I noted in Monday’s COT report that large speculators and manage funds trimmed longs over the past three weeks, and that managed funds increase shorts last week despite the Middle East conflict. And it is worth mentioning again.
The weekly chart appears to be bearish over the near term to my eyes, and already we can see momentum has turned lower for the week. The Q3 rally failed to close above the ‘double top’ highs and formed an indecision week, before momentum turned swiftly lower. And the fact that we then saw two relatively small bullish candles whilst headlines of a Middle East conflict took centre stage further raised my bearish suspicion. Momentum has turned lower for the week, and if US GDP disappoints of Jerome Powell is more dovish (or less hawkish) as expected, it could reduce Fed hike expectations, weigh on short duration yields and oil prices. Weak data from Europe is also another factor which could weigh on oil prices, and in all the time the Middle East conflict remains contained, oil does not look overly bullish all of a sudden.
WTI crude oil technical analysis (daily chart)
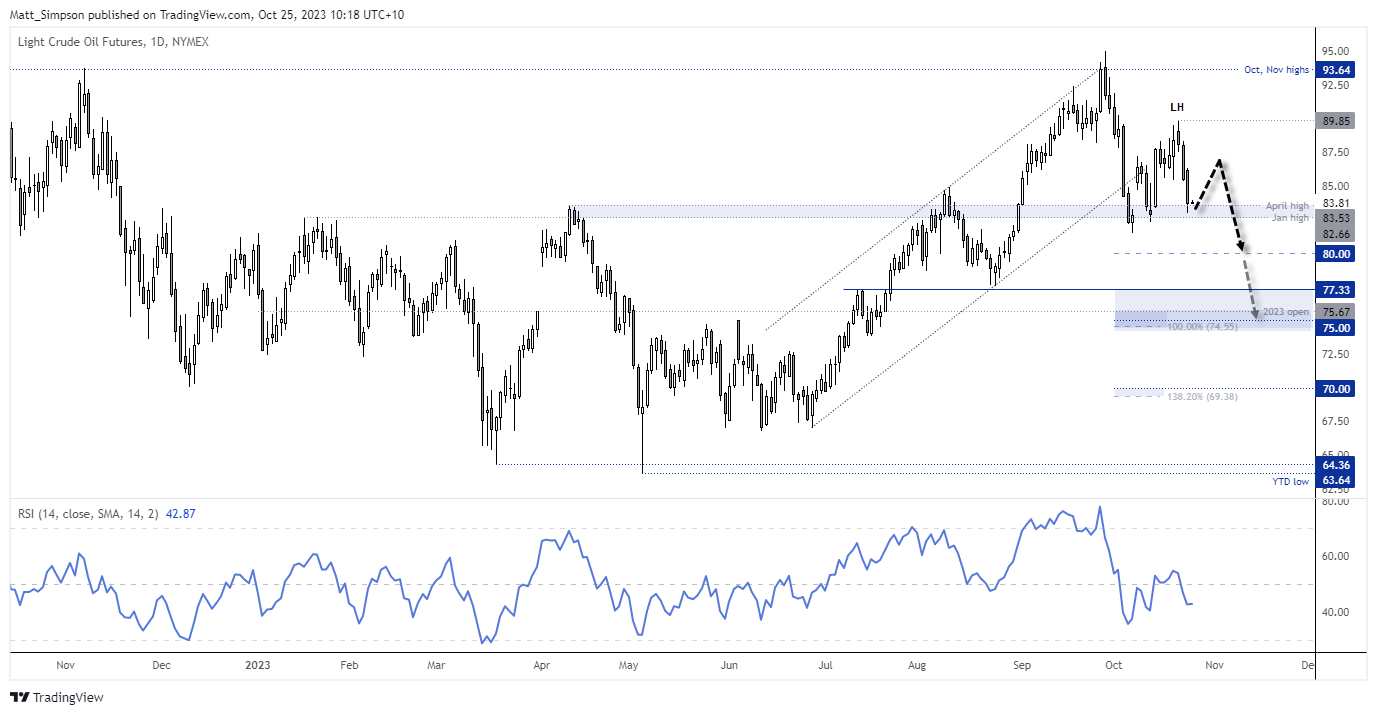
The daily chart shows that bearish momentum since the September peak has outweighed the strength of bullish momentum leading up to the peak. To me that suggests there could be further downside to come, which leaves it a case of identifying adequate reward to risk ratios for bearish setups.
Given support has been found around the January and April highs, I’d prefer to see a bounce from current levels to allow a fade (sell into a rally), on the assumption that prices will finally break support and head for $80. A break beneath which brings 77.33 into view.
However, if this is the beginning of a deeper correction, $75 and $75 may not be out of the question, which reside near the 100% and 138.2% Fibonacci projection levels.
-- Written by Matt Simpson
Follow Matt on Twitter @cLeverEdge
How to trade with City Index
You can trade with City Index by following these four easy steps:
- Open an account, or log in if you’re already a customer
• Open an account in the UK
• Open an account in Australia
• Open an account in Singapore
- Search for the market you want to trade in our award-winning platform
- Choose your position and size, and your stop and limit levels
- Place the trade
Related tags:
Latest market news




Open an account in minutes
Experience award-winning platforms with fast and secure execution, and enjoy tight spreads from 0.5 pts on FX and 0.3 pts on indices.
Economic calendar
Web Trader platform
Our sophisticated web-based platform is packed with features.
Related articles
Gold weekly outlook: XAU/USD holds above $4,000 despite strong US jobs data
Gold has held above $4,000 despite a much stronger-than-expected October jobs report. Fawad Razaqzada explains why lower yields and the tech sell-off have supported the metal, and why next week's US CPI could decide its next move.

Australian Dollar Short-term Outlook: AUD/USD 3% Plunge Puts Multi-Month Range at Risk 11 6 2026
A sharp equity-led selloff has driven AUD/USD toward critical June-low support, with strong NFP data adding pressure ahead of next week’s U.S. CPI.

Nasdaq 100 forecast: Tech stocks rebound but AI concerns linger
The Nasdaq 100 rebound has run into former support as fears over AI regulation and spending linger. Fawad Razaqzada explains why he maintains a cautious forecast and where the key levels sit.
This report is intended for general circulation only. It should not be construed as a recommendation, or an offer (or solicitation of an offer) to buy or sell any financial products. The information provided does not take into account your specific investment objectives, financial situation or particular needs. Before you act on any recommendation that may be contained in this report, independent advice ought to be sought from a financial adviser regarding the suitability of the investment product, taking into account your specific investment objectives, financial situation or particular needs.
StoneX Financial Pte. Ltd., may distribute reports produced by its respective foreign entities or affiliates within the StoneX group of companies or third parties pursuant to an arrangement under Regulation 32C of the Financial Advisers Regulations. Where the report is distributed to a person in Singapore who is not an accredited investor, expert investor or an institutional investor (as defined in the Securities Futures Act), StoneX Financial Pte. Ltd. accepts legal responsibility to such persons for the contents of the report only to the extent required by law. Singapore recipients should contact StoneX Financial Pte. Ltd. at 6826 9988 for matters arising from, or in connection with the report.
In the case of all other recipients of this report, to the extent permitted by applicable laws and regulations neither StoneX Financial Pte. Ltd. nor its associated companies will be responsible or liable for any loss or damage incurred arising out of, or in connection with, any use of the information contained in this report and all such liability is hereby expressly disclaimed. No representation or warranty is made, express or implied, that the content of this report is complete or accurate.
StoneX Financial Pte. Ltd. is not under any obligation to update this report.
Trading CFDs carries a high level of risk that may not be suitable for some investors. Consider your investment objectives, level of experience, financial resources, risk appetite and other relevant circumstances carefully. The possibility exists that you could lose some or all of your investments, including your initial deposits. If in doubt, please seek independent expert advice. Visit www.forex.com/en-sg/terms-and-policies for the complete Risk Disclosure Statement.