
- Unemployment steady at 4.1% despite job losses in February.
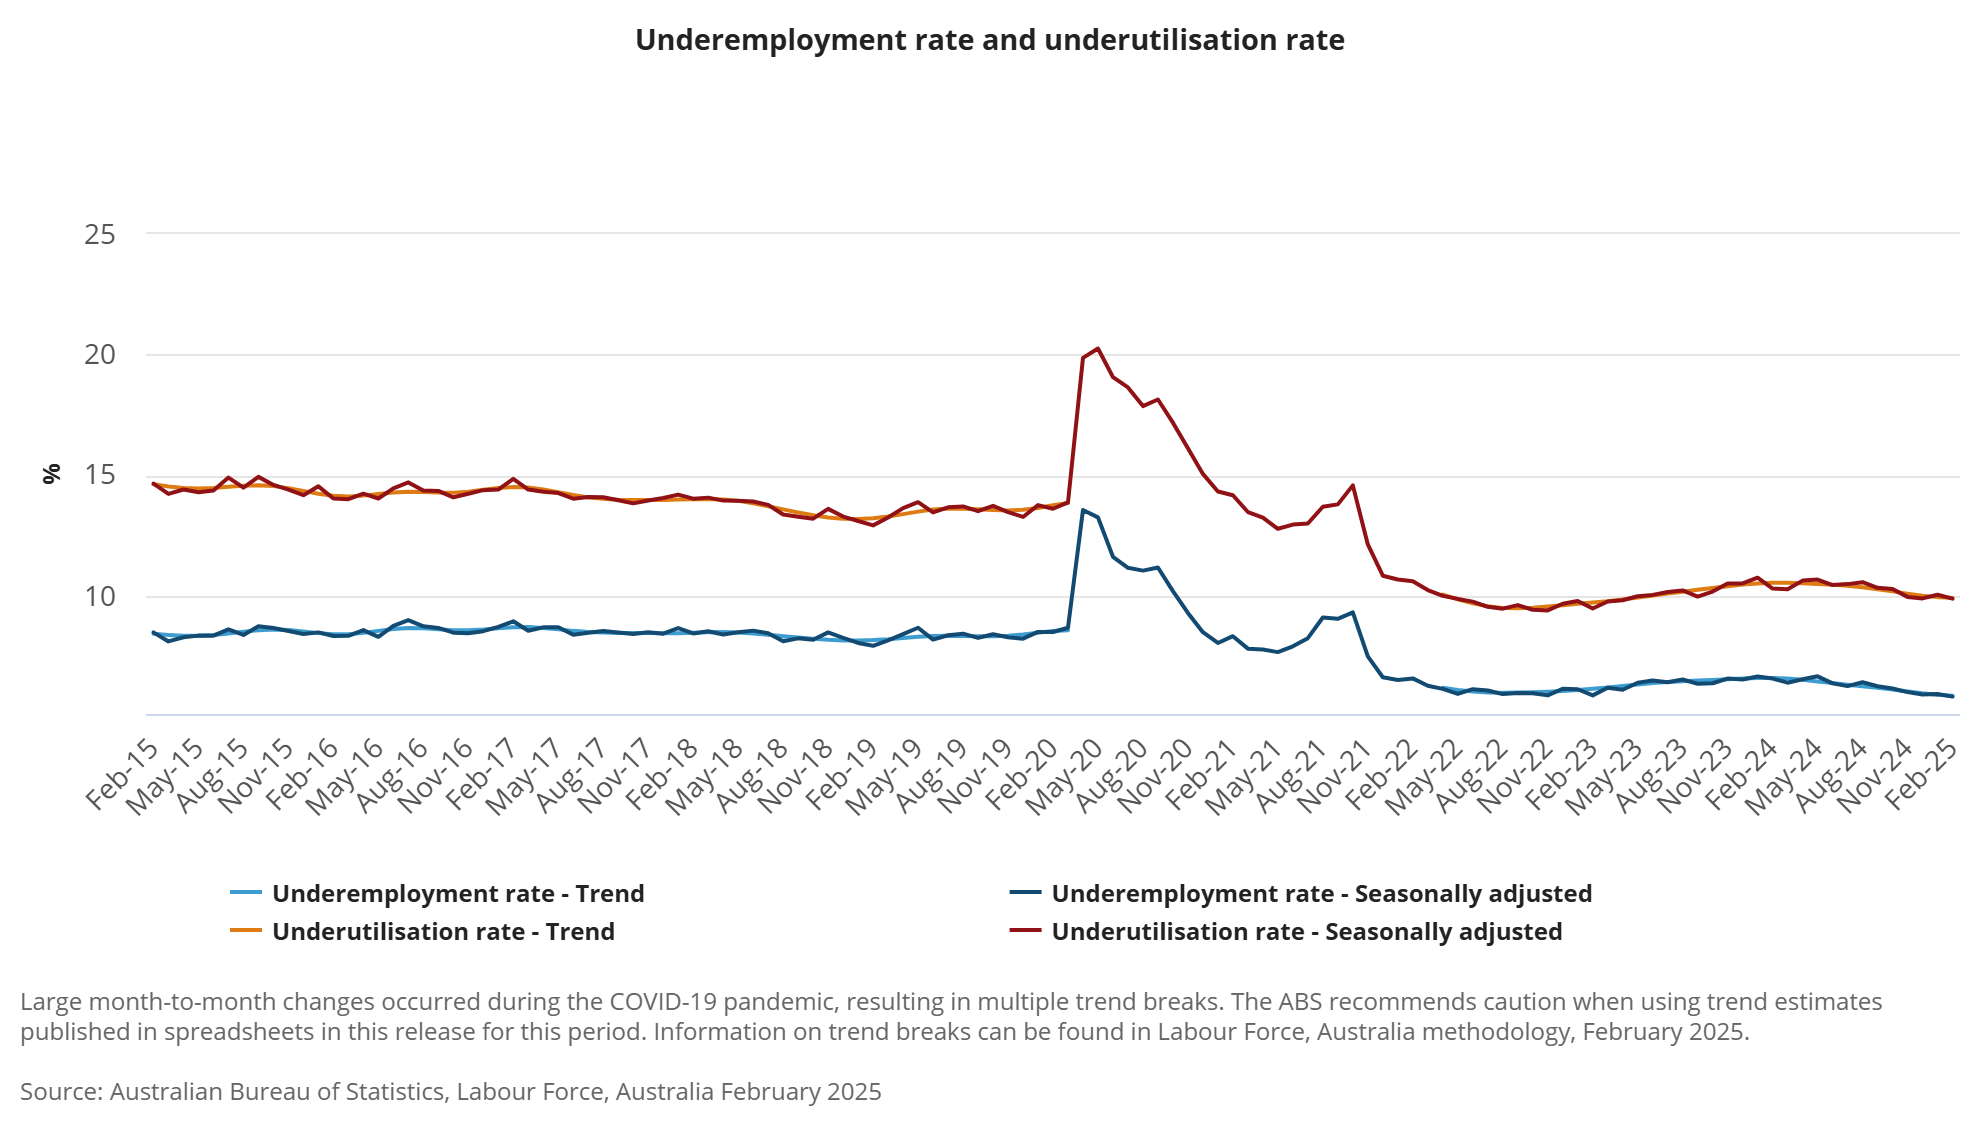
- Underemployment and underutilisation rates fell, reinforcing labour market strength
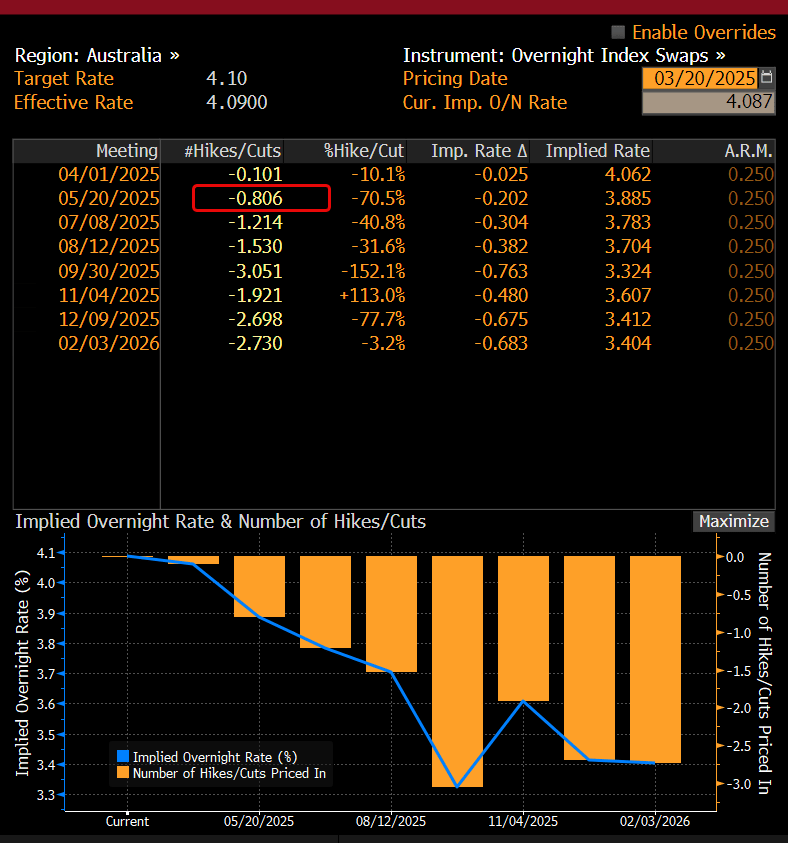
- RBA unlikely to cut in April, with swaps pricing just a 10% chance
- AUD/USD testing .6330 as market focus shifts back to China
Summary
A wave of retirees leaving the workforce wreaked havoc with Australia’s jobs report for February, driving a large decline in employment and a collapse in the labour force participation rate. Looking through the statistical noise, the figures that matter most to Australia’s interest rate outlook—unemployment and underutilisation—painted a far more stable picture of the labour market, making the likelihood of another RBA rate cut in April remote at best.
Employment Loss Superseded by Reduced Slack
Australia’s labour market held steady in February, with the unemployment rate unchanged at 4.1% despite a 53,000 drop in employment. Markets were expecting an increase of 30,000. A 0.4 percentage point decline in participation to 66.8% helped absorb job losses, keeping unemployment steady,
While headlines may focus on the decline in jobs, the real takeaway for the RBA was the ongoing tightness in labour market conditions. The underemployment rate fell to 5.9%—its lowest level in years. The broader underutilisation rate also eased to 9.9%, reinforcing the resilience of the jobs market.
Underemployment refers to people working part-time or casually but wanting more hours or full-time work. Underutilisation combines underemployment and unemployment, showing the overall unused labour capacity in the economy. Lower outcomes traditionally lead to stronger wage growth and inflationary pressures.
Countering the February result, employment growth over the year remained solid, tracking near long-term averages, while the employment-to-population ratio remains historically high despite February’s dip.
Source: ABS
For the RBA, this mix matters more than month-to-month employment swings. A stable jobless rate, declining slack in the labour market, and still-high participation suggest demand for workers remains firm. While hours worked softened in February, annual growth in hours outpaced employment, underscoring sustained labour market strength. With inflation still a concern, policymakers at the RBA are unlikely to see this as a signal to ease anytime soon.

RBA May Cut Expected
Swaps traders certainly agree, with the implied probability of the RBA delivering a second interest rate cut this cycle on April 1 sitting at just 10%. That feels about right. Looking further out, a move in May—following Australia’s next quarterly inflation report in late April—is deemed probable at around 80%.
Source: Bloomberg
While the jobs report took the wind out of the Aussie’s sails, as covered in a separate note earlier this week, sentiment towards the Chinese economy remains a far more influential factor for the AUD, particularly the performance of the Chinese yuan. Once the volatility from the jobs report dies down, expect that relationship to reassert itself.

AUD/USD: Bullish Bias Retained
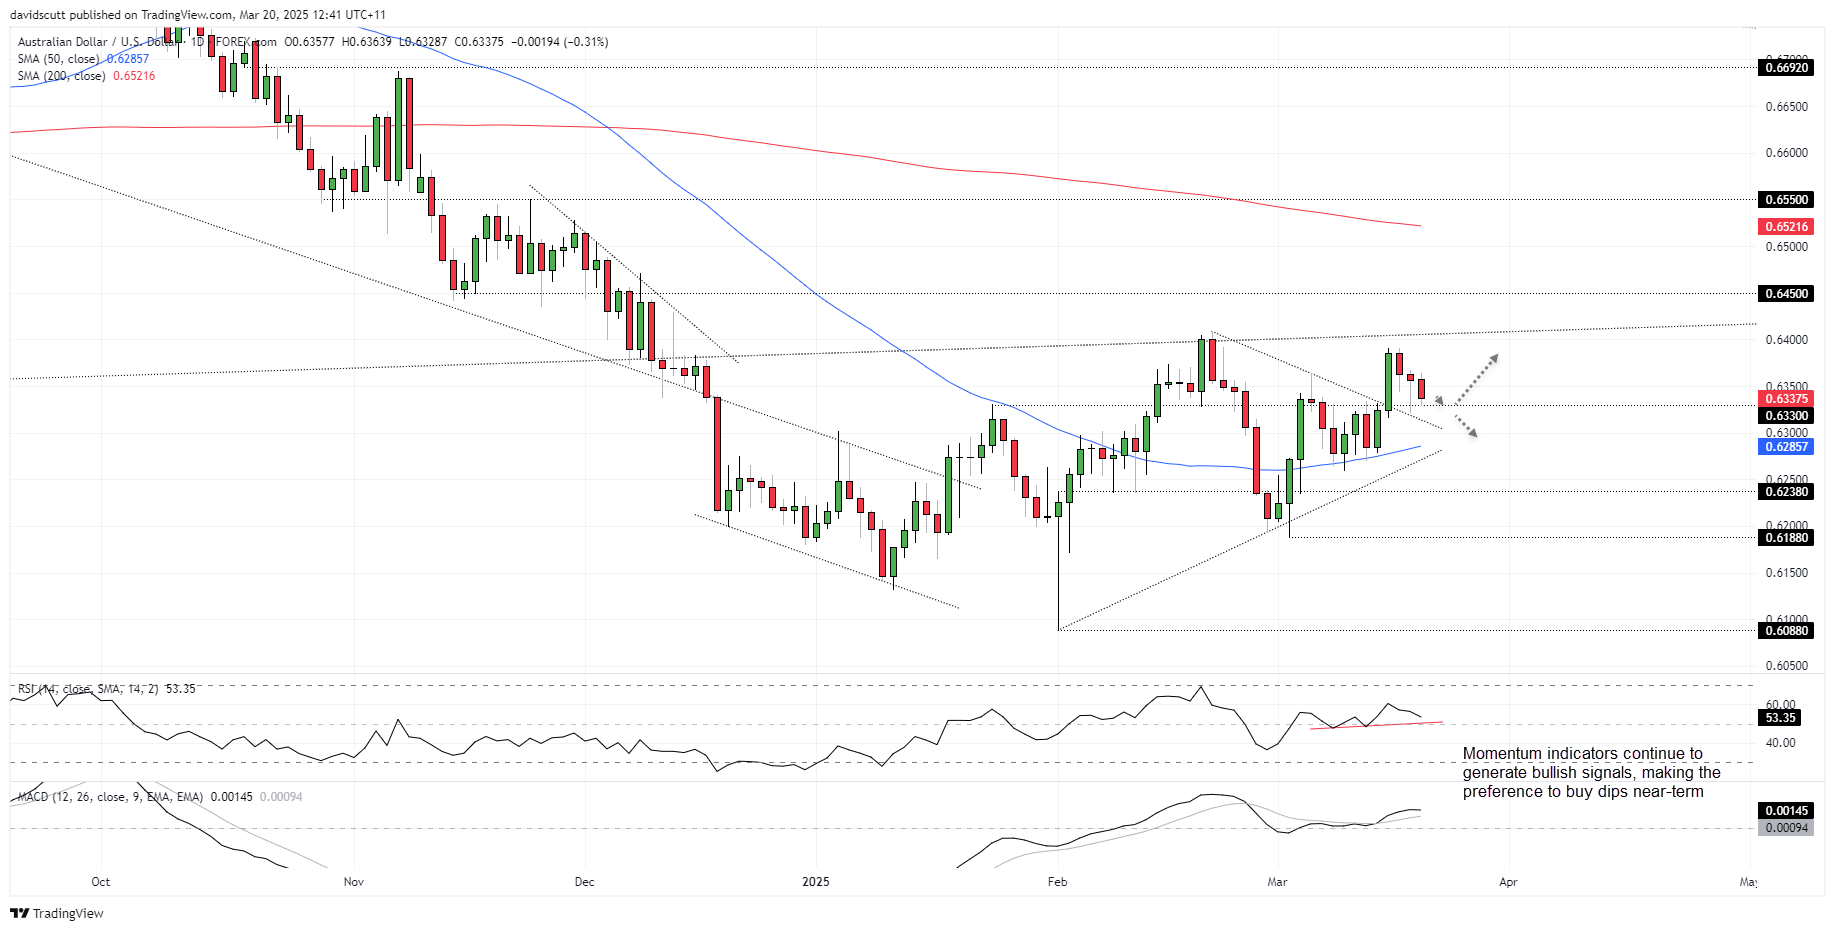
AUD/USD is testing .6330 following the jobs report, a level the price has done plenty of work either side of during the past two months. That should be the immediate focus for traders.
Source: TradingView
RSI (14) and MACD are still trending higher, providing a bullish momentum signal that favours upside over downside. If AUD/USD bounces from .6330, traders may want to initiate longs above with a tight stop beneath for protection, targeting a move back towards .6390 where the pair stalled twice earlier this week. Wednesday’s hammer candle on the daily chart bolsters the case for buying dips around this level.
However, if we see a sustained break of .6330, the setup could be flipped, with shorts initiated beneath with a stop above for protection. The 50-day moving average looms as a potential target—it currently sits at .6286. Beyond that, .6238 screens as another downside level of note.
-- Written by David Scutt
Follow David on Twitter @scutty