
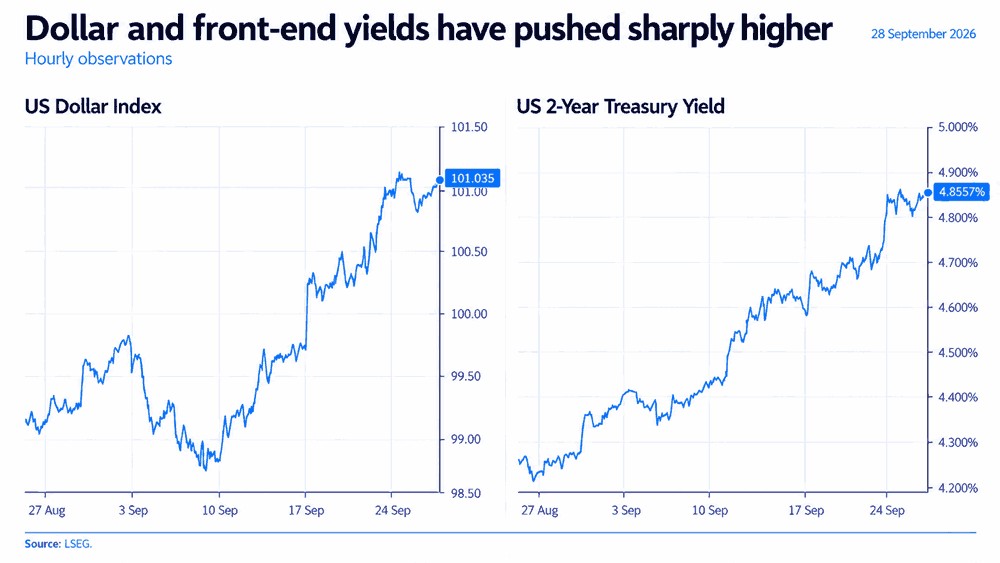
- Gold-DXY correlation hits -0.93 over five sessions
- Gold-US 2-year correlation tightens to -0.98 over five sessions
- US 2-year yield rise ranks in 98th percentile since 1988
Gold hit as dollar and yields push higher
Gold has come under renewed pressure in early Asian trade on Monday, falling to its lowest level since early August as the US dollar and Treasury yields push higher alongside another jump in crude oil futures.
The move follows Donald Trump’s rejection of an Iranian proposal that would have reopened the Strait of Hormuz within seven days and brought an end to fighting, subject to a series of conditions put forward by Tehran that the US has repeatedly said are unacceptable. Those conditions have remained a major sticking point in negotiations.
Gold moves close to lockstep with macro drivers
For gold and the broader precious metals complex, those moves matter because both the US dollar index and nominal US yields have maintained a strong inverse relationship recently, considerably stronger than with other traditional drivers such as real yields.
Over the past five sessions, gold’s correlation with the DXY has hit -0.93 in levels, towards the extremes seen in data going back several decades. The inverse relationship has also remained meaningful over longer windows, with the 20-session correlation sitting around -0.59.
The relationship with nominal Treasury yields has been even stronger recently. Over the past month, gold’s correlation with the US 2-year, 5-year and 10-year yields has sat at around -0.76, -0.79 and -0.80 respectively. Over the past five sessions, those relationships in levels have tightened further to roughly -0.98, -0.99 and -0.97.
Put simply, that’s close to lockstep territory. Over the past week, gold and nominal US yields have moved almost perfectly in opposite directions, while the inverse relationship with the DXY has also been exceptionally strong.
Source: LSEG
Hawkish Fed repricing hits extreme territory
Not only is gold reacting to movements across the US yield curve, but at the front end the move has been outright extreme. Over the past 20 sessions, the US 2-year yield has risen around 55 basis points, placing the increase around the 98th percentile of comparable four-week moves since 1988. At its most extreme last week, the rise exceeded 66 basis points, ranking among the largest 1% of moves over that period.
As such, it comes as little surprise that gold has struggled. You could also argue it’s pretty remarkable that the price has managed to hold up as well as it has given the velocity of the move in US yields.
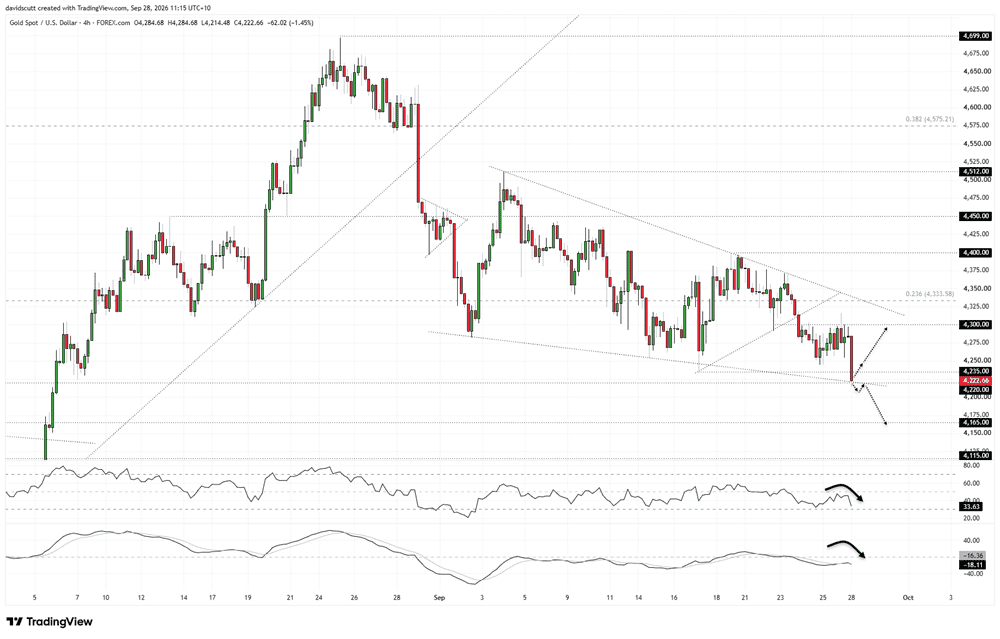
Gold bears eye a break of key September support
Source: TradingView
After struggling above $4,300 late last week, gold is now testing the lower end of the falling wedge structure it has been carving out for much of September.
On the four-hourly chart, the price is already trading beneath $4,235, the low set on September 17, with the lower boundary of the wedge now intersecting with horizontal support at $4,220. That level has acted as support and resistance on multiple occasions this year, making it the immediate downside level of focus.
If we were to see a test and failure to break beneath the confluence of those supports, longs could be set with a tight stop beneath for protection, targeting $4,245, the low set on September 25, and then $4,300, where the price struggled to break through heading into the weekend.
If the support structure were to break cleanly, preferably followed by a back test and rejection from the zone, shorts could be initiated with a tight stop above for protection, targeting $4,165 and then $4,115.
The overall message is one that prefers selling into strength and downside breaks, although I want confirmation from price action before acting on that bias.