
US equity futures were edging slightly higher in the first half of Thursday’s session, while European markets remained mixed after a fairly weak handover from Asia overnight. In the US, there’s very little in the way of major macro data today apart from weekly jobless claims, with the real focus shifting to Friday’s inflation numbers and then retail earnings and GDP next week. The near-term S&P 500 forecast continues to revolve around one simple question: can the market finally build enough momentum to clear the psychologically important 7,000 level?
The index has been noticeably choppy over recent sessions. We saw a familiar pattern again yesterday: an initial rally following the strong US jobs report, followed by a pullback as traders digested what stronger labour data actually means for Fed policy. In simple terms, good economic data is positive for growth, but it also reduces the urgency for rate cuts. That tension continues to dominate price action. Dip buyers did step in late in the session, helping lift the index off its lows, but once again the market failed to close convincingly above the 7,000 handle. This remains the key question for traders right now: is the market simply consolidating before another leg higher, or are we running out of momentum and due a correction?
S&P 500 forecast: macro backdrop still supportive, but fragile
From a macro perspective, the latest NFP report delivered a classic “goldilocks” narrative for equities. The labour market is still holding up, which supports the broader economic outlook. However, it also reinforces the idea that the Fed doesn’t need to rush into cutting rates. The Fed has been very clear that it is more interested in trends rather than individual data points, but stronger jobs data makes it harder for doves to argue for early easing. That shifts the spotlight firmly onto Friday’s inflation print. If inflation shows further signs of cooling, rate cut expectations will likely be revived and risk assets could benefit. If not, markets may start to reprice for higher-for-longer once again, which could introduce more volatility and complicate the short-term S&P 500 forecast.
S&P 500 technical analysis
From a technical perspective, the S&P 500 remains in a clear bullish trend. The index is still trading comfortably above its 200-day moving average, and the broader structure of higher highs and higher lows remains intact. That said, momentum is starting to look like the main concern.
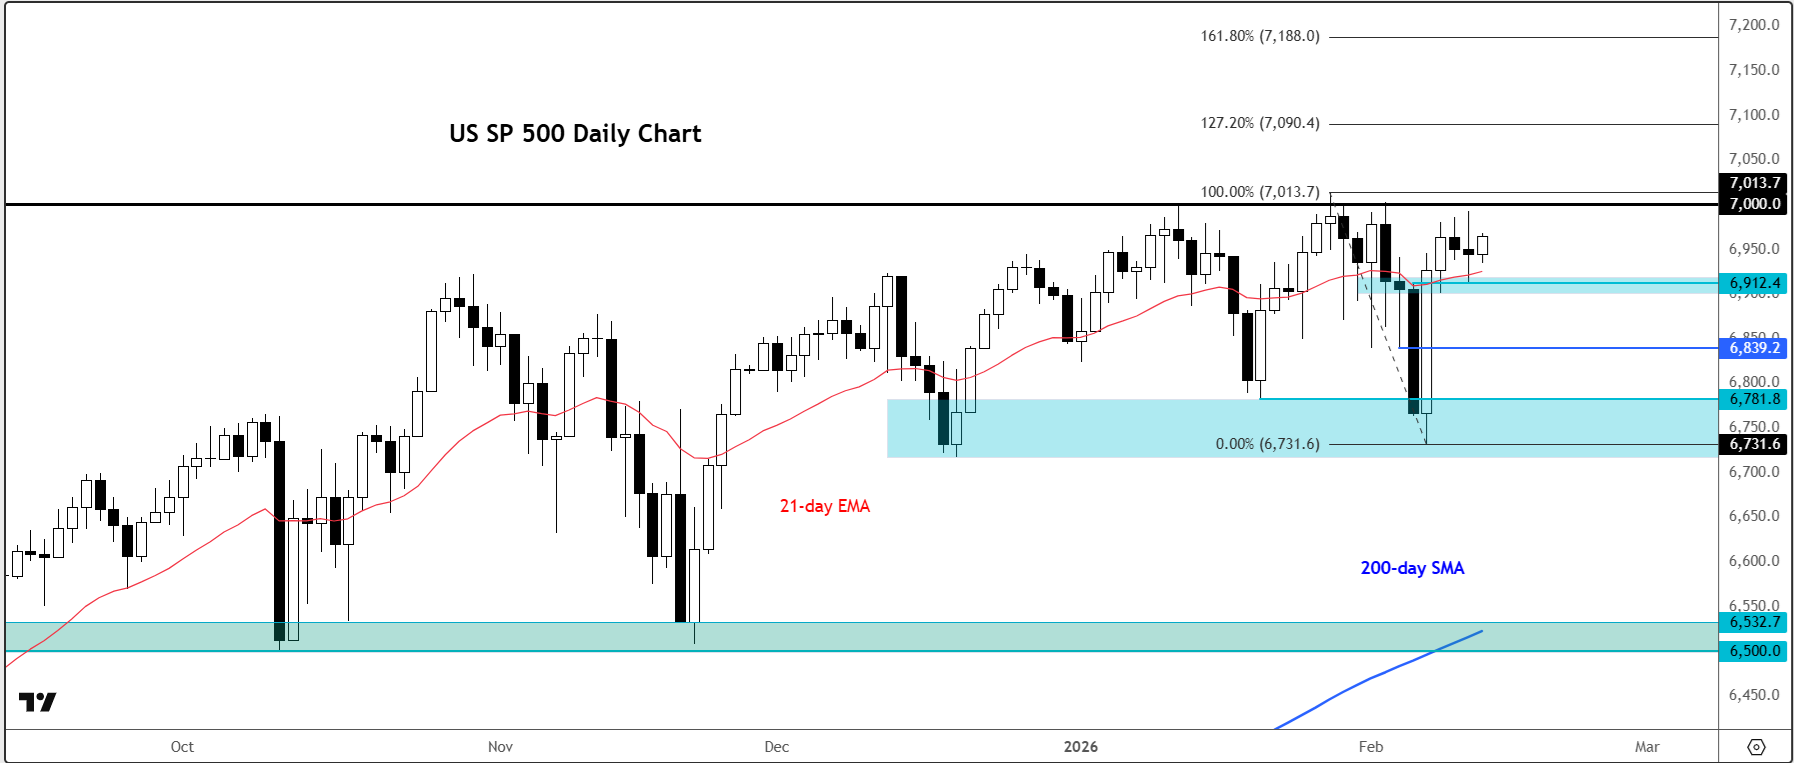
Last Friday’s strong rally produced a powerful bullish engulfing candle on the daily chart of the S&P 500. Normally, you would expect to see some strong follow-through after a move like that. Instead, price action has been relatively muted, with the index repeatedly stalling just below the 7,000 handle.
We’ve now neared this resistance level several times over recent days, and each attempt has failed to generate a clean breakout. That doesn’t automatically mean the market is about to roll over, but it does suggest buyers are losing urgency. If this lack of momentum continues, it wouldn’t be surprising to see more traders start looking for short-term short setups, particularly if macro data disappoints.
Key levels to watch on the S&P 500
On the downside, the first area of interest sits around 6912, which has acted as short-term resistance and then support over the last few sessions. A break below this zone would likely expose the next support level around 6840ish. If that area fails to hold, the short-term outlook would start to look more bearish. The next major level comes in around 6780ish to 6731ish, with the latter marking Friday’s low. Below that, there is not much near-term support levels until a key area from October and November lows that also coincides with the rising 200-day moving average, around 6,500 to 6,532. That makes it a major confluence zone and a logical area where dip buyers could re-emerge if the market does correct.
For now, though, the trend is still bullish, and this could simply be a healthy consolidation phase. Indeed, a potential daily close above 7,000 would be the technical signal many breakout traders are waiting for. A clean breakout could open the door for a move to clear blue skies with Fibonacci extension targets of 127.2% and 161.8% from the most recent corrective move project towards 7,090 and 7,188 respectively.
In short, the S&P 500 forecast remains constructive, but momentum is fading. The next few sessions – and especially Friday’s inflation data – are likely to determine whether 7,000 finally gives way, or whether we see a deeper pullback before the next leg higher.

-- Written by Fawad Razaqzada, Market Analyst
Follow Fawad on Twitter @Trader_F_R