




Technical Tuesday: S&P 500, Dollar Index, GBP/USD and Gold
In this week’s edition, we are getting technical on the Dollar Index, S&P 500, GBP/USD and gold
Share this:

Welcome to Technical Tuesday, a weekly report where we highlight some of the most interesting markets that will hopefully appease technical analysts and traders alike.
In this week’s edition, we are getting technical on the Dollar Index, S&P 500, GBP/USD and gold
- Dollar index testing 200-day average
- S&P key levels to watch
- GBP/USD below 1.20 handle again
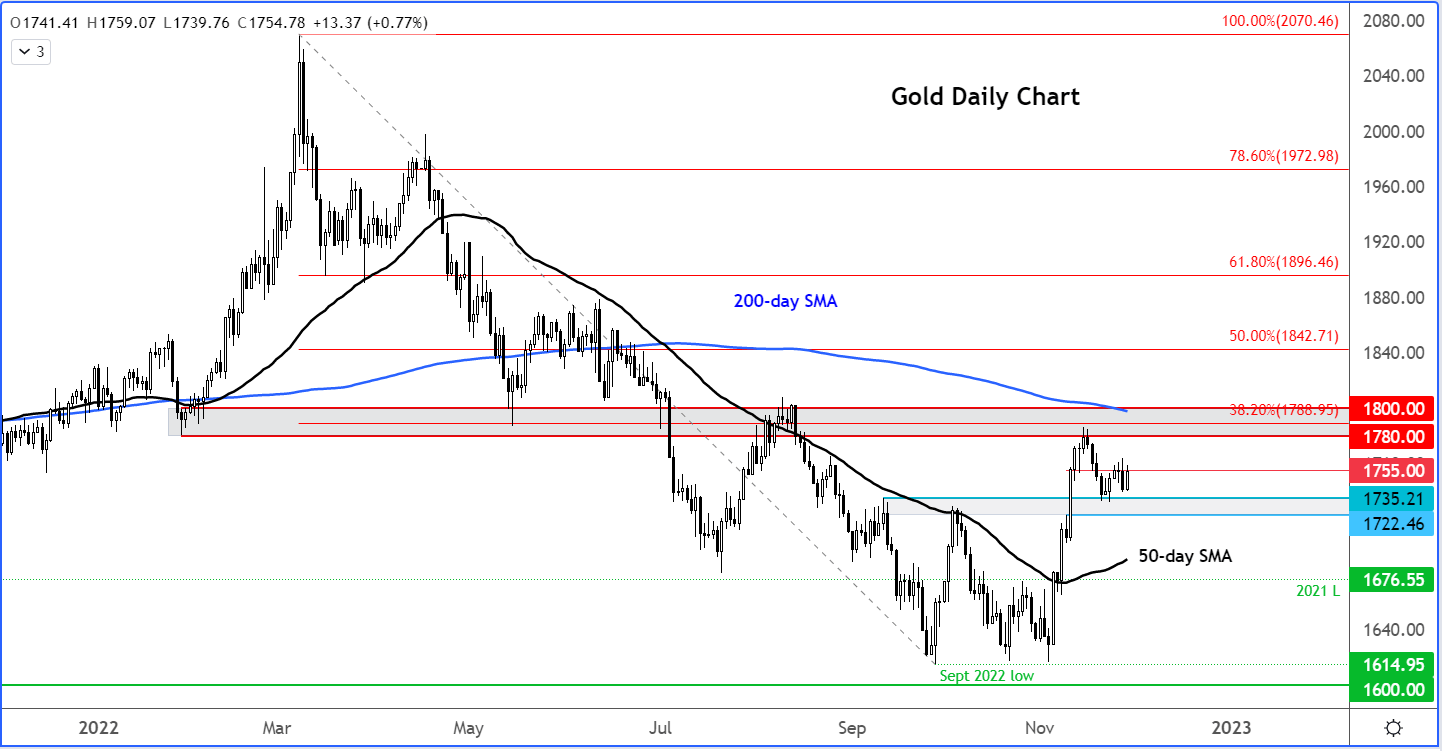
- Gold stuck between key levels
Dollar Index testing 200-day average
The dollar index has shown some signs of life around its 200-day average and support in the 1.0500-1.0540 area. But it is far too early to say whether it will bounce sharply here and turn into a full-on rally. However, it is a key support area and we are still inside a long-term bull trend. After the recent sell-off, the downside risks have now diminished in my view.
What the dollar bulls will want to see next is for the DXY to print a short-term higher high now, above 108.00. If this condition is met, then we could see follow-up technical buying towards the base of the breakdown at 109.45 next.
As well as the ongoing situation in China, investors will look ahead to a busy week for macro data, which will include the publication of US GDP on Wednesday and non-farm payrolls report on Friday. Fed Chair Jerome Powell will also be speaking on Wednesday. If Powell re-iterates the Fed's commitment to bringing inflation down through further rate rises and mentions that one or two inflation reports are not enough to suggest the Fed's job is done, then this could trigger a dollar recovery.
S&P 500 key levels to watch
The S&P 500 fell noticeably on Monday as traders showed some respect to the 200-day average and key resistance starting around 4040 in the range between 4040 to 4100. This is going to be the most important zone to watch given that the 200-day average and long-term bear trend both meet there. So far, the bulls have been reluctant to press ahead. The bears will need to reclaim a few broken levels before they are back in full control again.
Short-term support around 4975 was being eroded at the time of writing. The next important level on my radar is at 3920ish, which also converges with the short-term up trend. Below that 3840 is the next level for the bulls to defend.
GBP/USD below 1.20 handle again
The GBP/USD has fallen back below the 1.20 handle after being more than 150 pips higher last week. The earlier GBP/USD strength had been driven largely by US dollar weakness. There’s also been some strength for GBP as Rushi Sunak appears more resolute than his predecessor in trying to address rising borrowing costs. But the GBP/USD continues to face major headwinds from multiple fronts.
Anyway, we will cover the macro factors some other time. For now, let's focus on the techncals...
The GBP/USD is showing some weakness around these key levels, which is not to be taken lightly if you are long or bullish on the cable. The slope of the 200-day is negative, meaning that despite the big recovery, the long-term trend remains objectively bearish. As such, there is always the danger that the longer-term bearish trend could resume at any moment.
However, like many other markets, the bears will now need to see a lower low on the short-term charts. The most recent low was printed at around 1.1775 before the latest leg up. This level is now pivotal. The bulls will remain hopeful while above it, and the bears largely on the side-lines. A potential breakdown could pave the way for a drop to 1.15s.
Gold stuck between key levels
Gold has been stuck between two major zones in recent days. The upside has been capped by strong resistance starting around $1780 to $1800. Here, previous support meets the 200-day average (now sloping downwards) and 38.2% Fibonacci level against this year’s high. The downside has been supported – for now – by previous resistance around $1722-$1735 area.
Once one of these ranges break, then we might see a more pronounced move in gold prices in the direction of the break. Could the trigger be provided by Fed Chair Jerome Powell’s speech on Wednesday? For what it is worth, I am leaning towards the bearish argument for gold, due to still-rising interest rates around the world.
How to trade with City Index
You can trade with City Index by following these four easy steps:
- Open an account, or log in if you’re already a customer
• Open an account in the UK
• Open an account in Australia
• Open an account in Singapore
- Search for the company you want to trade in our award-winning platform
- Choose your position and size, and your stop and limit levels
- Place the trade
Latest market news




Open an account in minutes
Experience award-winning platforms with fast and secure execution.
Economic calendar
Web Trader platform
Our sophisticated web-based platform is packed with features.
Related articles
Gold and silver forecast: Precious metals extend drop but seasonality hopes keeps bullish case alive
It has been a risk off session so far today with stocks, gold and especially silver (-4%) all taking a drop. Gold has fallen to a fresh 2026 low and its now more than $100 below the psychologically important $4,000 mark. A firmer US dollar, rising US rate expectations and fading safe-haven demand have combined to undermine the metal, despite continued central bank buying. This year has so far been a bad one for gold.
Nasdaq 100 Forecast: NDX falls ahead of Nvidia’s earnings & Anthropic’s debut this week
U.S. stocks are heading for a weaker open amid a challenging macro backdrop and with AI-linked stocks once again under pressure ahead of Nvidia's results later this week. Attention is also turning to Anthropic's highly anticipated IPO.

EUR/USD forecast: Dollar strength puts 1.1000 support in the spotlight | Currency Pair of the Week
The dollar extended its recent advance at the start of the week, with weakness across risk-sensitive assets reinforcing demand for the US currency. US equity futures slipped ahead of Nvidia’s earnings on Tuesday and an expected stock market debut by Anthropic later this week. Both events represent important tests for an AI trade that has become increasingly vulnerable to shifts in sentiment. In FX, EUR/USD nearly tested the psychologically important 1.1000 level, before bouncing modestly off its lows.
StoneX Financial Ltd (trading as "FOREX.com") is an execution-only service provider. This material, whether or not it states any opinions, is for general information purposes only and it does not take into account your personal circumstances or objectives. This material has been prepared using the thoughts and opinions of the author and these may change. However, FOREX.com does not plan to provide further updates to any material once published and it is not under any obligation to keep this material up to date.
This material is short term in nature and may only relate to facts and circumstances existing at a specific time or day. Nothing in this material is (or should be considered to be) financial, investment, legal, tax or other advice and no reliance should be placed on it. No opinion given in this material constitutes a recommendation by FOREX.com or the author that any particular investment, security, transaction or investment strategy is suitable for any specific person.
The material has not been prepared in accordance with legal requirements designed to promote the independence of investment research. Although FOREX.com is not specifically prevented from dealing before providing this material, FOREX.com does not seek to take advantage of the material prior to its dissemination. This material is not intended for distribution to, or use by, any person in any country or jurisdiction where such distribution or use would be contrary to local law or regulation. For further details see our full non-independent research disclaimer and quarterly summary.