
US Dollar Talking Points:
- Despite building expectations for a rate hike from the Fed and even a second hike by the end of the year, it’s been a red week for the US Dollar which likely points back to the continued sell-off in USD/JPY more than any individual fundamental factor.
- While CPI came in right at the expected 3.4% for headline and 2.4% for core, it was the inflation expectations in the U of M survey that really stand out as it shows widespread expectation for prices to continue moving higher.
- The ECB hiked rates yet EUR/USD sets up a doji on the weekly, further highlighting how the crowded USD/JPY carry trade is likely playing a larger role in DXY dynamics.

If you look at anything but the chart it really seems like the past week is one where the US Dollar should’ve broken out in a very big way. Sure, the ECB did hike rates by 25 basis points but the initial reaction to that announcement showed how well it was already priced-in, to the degree that ECB ‘sources’ needed to come out after the fact and highlight the possibility of another hike to get bulls back on the bid.
But from an inflation front, prices remain elevated and they’re not softening. Oil had another trip above the 100-level, which highlights the prospect of even more inflation down-the-road. Treasury yields spiked in a very big way, as the benchmark 10-year note came just one basis point away from the psychologically important 5% mark; and meanwhile the 30-year bond hit yet another fresh 19-year high.
And to roll all of that up in a cleaner fashion, expectations around the Fed jumped to 90% for a hike at next week’s meeting and close to 70% for another 25 bp hike by year end.
These are all factors that would normally equate to a strong USD, providing the fundamental case for breakout and fresh highs. But, that’s not what happened – and it’s in those cases where reality diverges from the ‘should have’ that traders should really take note, as there’s probably something else going on. And for future price moves, it’s that ‘something else’ that can prove most important.
My opinion on the matter is that in this case, it’s the continued unwind of the USD/JPY carry trade. We had a big item on that front this week when US Treasury Secretary Scott Bessent talked about it, saying that he had access to asymmetric information and he knows what the Bank of Japan and Japanese policymakers will be doing. He went on to bait market participants by saying ‘you can bet against me if you want.’
USD/JPY was already on it’s back foot following the prior week’s sell-off from 160.00, and Bessent’s remarks didn’t lead to an immediate continuation of trend.
But as I had highlighted a month ago, the intervention that we’ve seen thus far can effectively cap the theoretical upside for longs, even with the fundamental backdrop still leaning in that direction. And given how crowded the trade remains to be, diminishing risk-reward ratios can, eventually, lead to a larger reversal. And that reversal can take on even more life if data begins to tilt in the other direction which hasn’t really happened yet.
Below we can see a handful of retracements in the USD/JPY trend over the past four years and notice how this market has taken an ‘up the stairs, down the elevator’ type of feel. But also notice how recently, it seem like bears have re-taken control from longer-term charts and this really highlights the essence of that contrarian case in USD/JPY.
USD/JPY Weekly Chart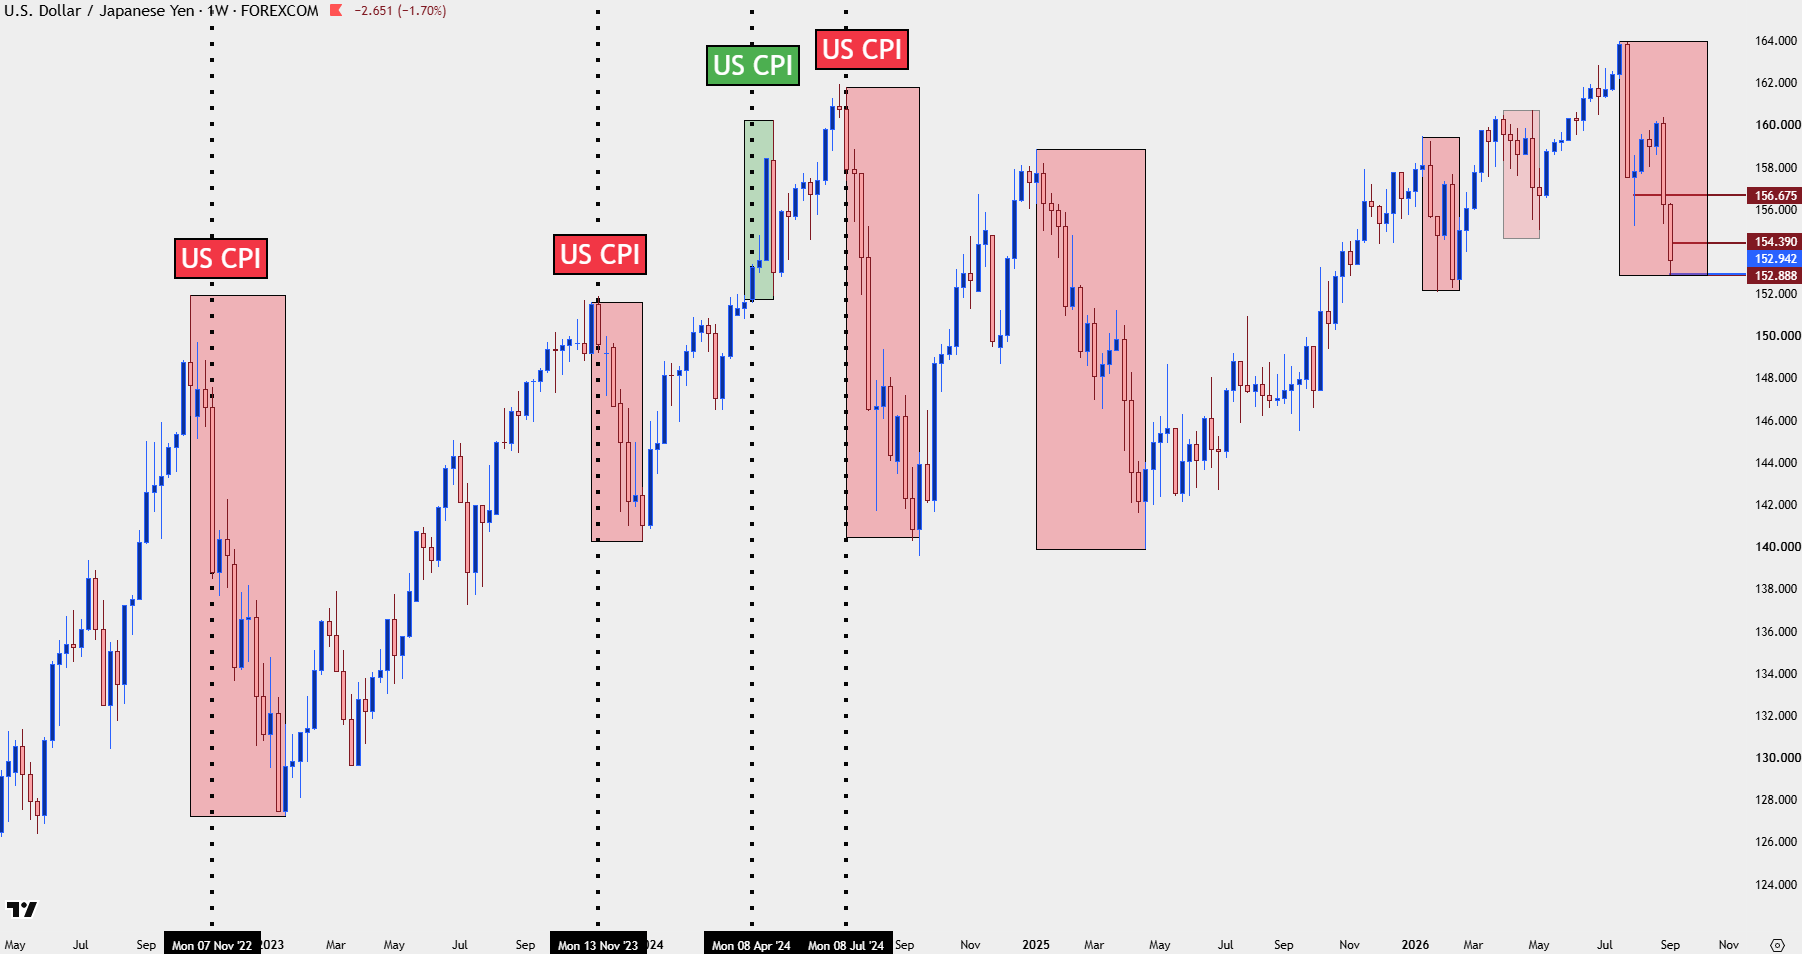
Chart prepared by James Stanley; data derived from Tradingview
Dollar Divergence
Again putting into scope the past week there were multiple factors that should’ve pushed a stronger Dollar yet DXY is limping into the weekly close in the red. This also highlights how in both USD and USD/JPY, a ‘sell the rip’ mode could be of attraction particularly if we see the Fed invoke a breakout by taking a hawkish stance around a rate hike on Wednesday.
In DXY, this highlights the zone from 99.69-100 as a major point of emphasis for sellers to defend on rallies or attempts to breakout.
US Dollar Daily Price Chart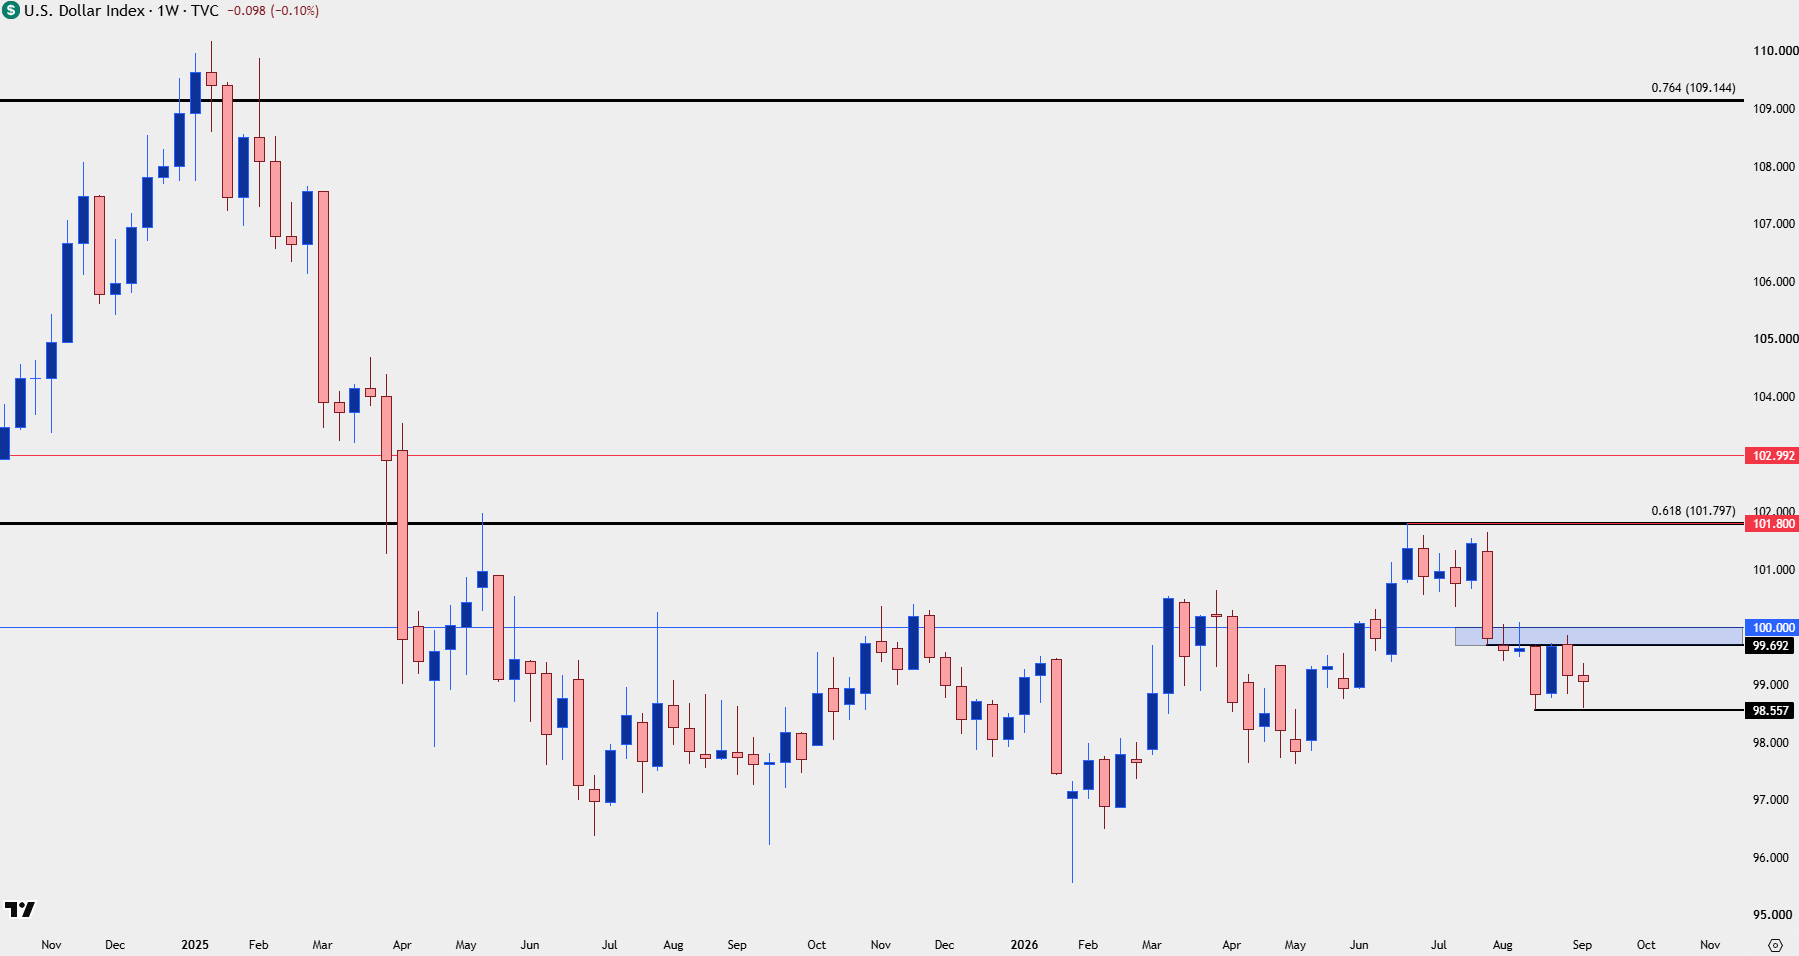
Chart prepared by James Stanley; data derived from Tradingview
USD/JPY Buy the Dip to Sell the Rip
We’ve seen a degree of this already but so far, the pair has stalled around the 153.00 handle. Like I said in the immediate aftermath of the intervention in July, there could still be a compelling value proposition on the long side after one of these types of slides. After all, the fundamental backdrop still tilts in that favor with strong US inflation data and higher odds of tighter policy from the Fed.
The bigger question for larger trends is whether bulls use bounces to pare longer-term positions in anticipation of a continuation of lower-lows and lower-highs.
The Bessent remarks certainly seem to have played a role in the matter last week but, realistically, there could be scope for a rally up to the 155.00-155.23 zone, or perhaps even the 156.68-157.22 area. Or – for those that do want to treat the situation more aggressively, it’s the prior swing high around 154.39 that ended up holding bulls at bay from an earlier-week bounce.
USD/JPY Four-Hour Price Chart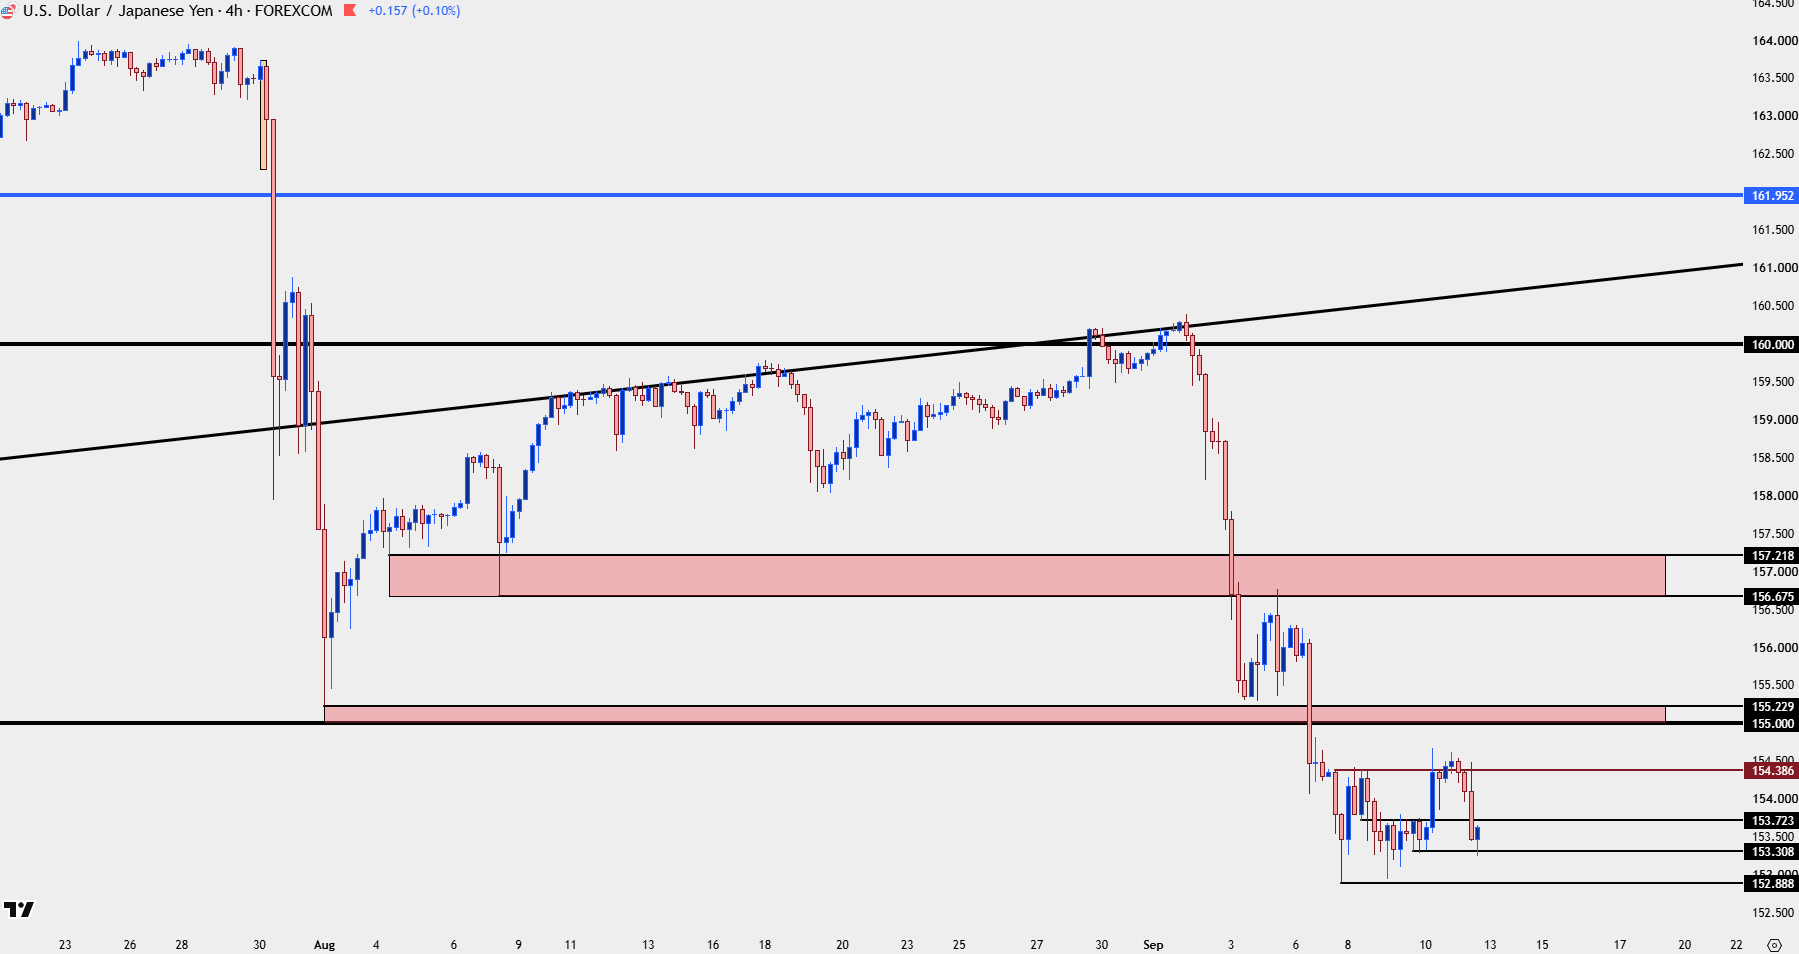
Chart prepared by James Stanley; data derived from Tradingview
EUR/USD
The ECB hiked rates but this wasn’t something that took many by surprise as the bank had telegraphed the move well in advance. Perhaps more surprising was the lack of reaction around the announcement, as a ‘rate hike sell-off’ was followed by the usual ‘ECB sources’ speaking to the media after the announcement to say that the bank is open to another rate hike in the near-term.
On the longer-term chart, EUR/USD remains below a massive spot of resistance and this is the same zone that’s held bulls back for about 15 months at this point. It’s the 76.4 and 78.6% Fibonacci retracements of the 2021-2022 major move.
EUR/USD Weekly Chart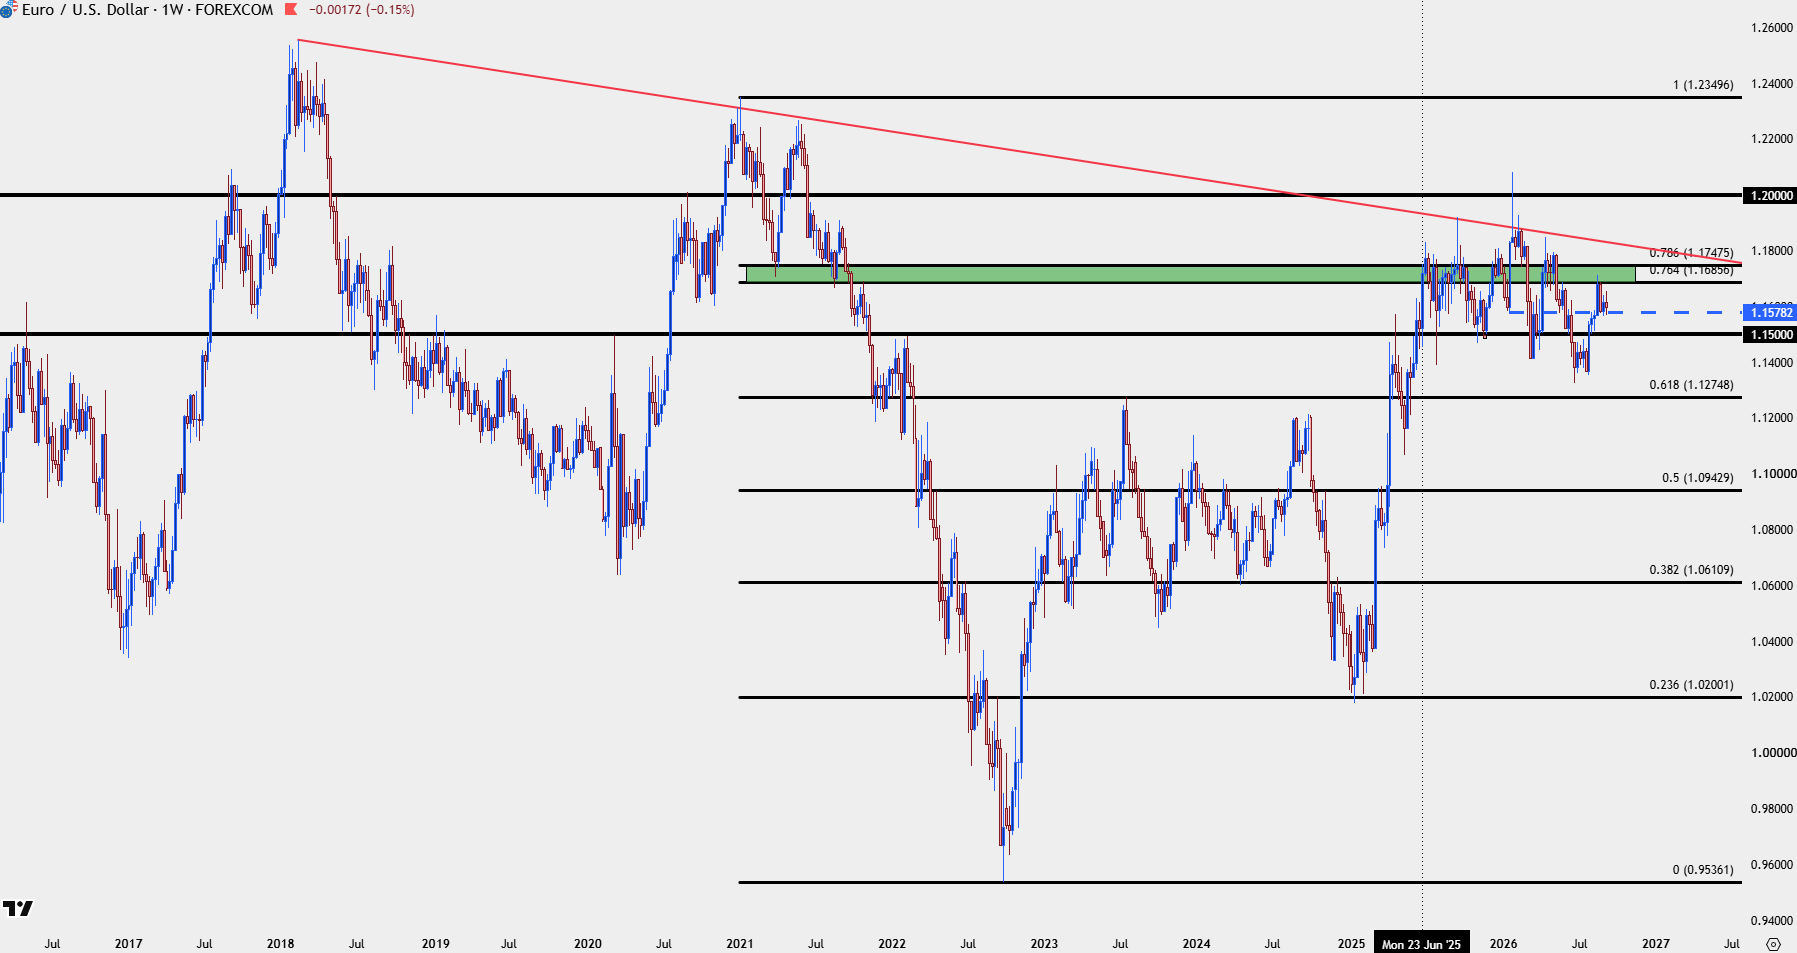
Chart prepared by James Stanley; data derived from Tradingview
EUR/USD Daily
From the daily chart, support after the ECB hike posted at a prime spot, the 1.1578 swing that held support in the previous week, as well. This can also be argued as support showing at prior resistance, which keeps the door open for bulls as we go into next week.
EUR/USD Daily Chart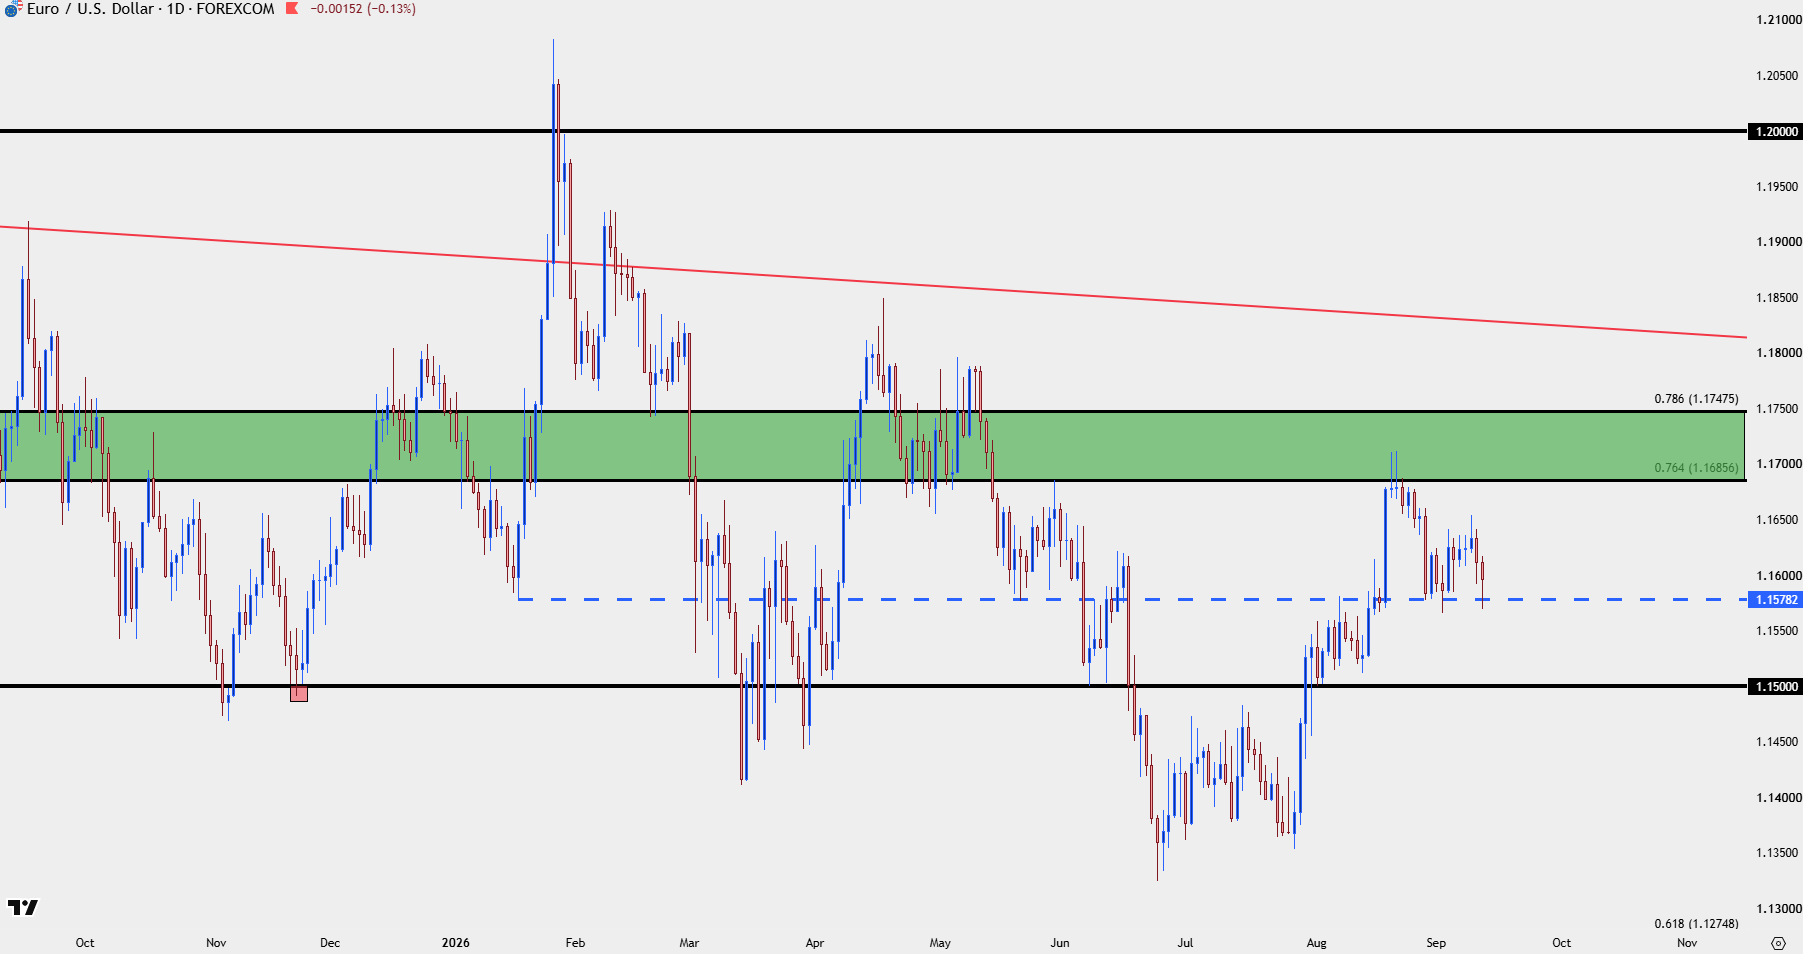
Chart prepared by James Stanley; data derived from Tradingview
--- written by James Stanley, Senior Market Analyst, Global Macro