



Will it be Santa’s rally or Satan’s rally for the Nasdaq in December?
Santa’s rally is usually a timely seasonal pattern that sees equity markets rally in December. The Nasdaq is not off to a great start at -8% MTD, but perhaps don’t write it off just yet.
Share this:

The Nasdaq’s Santa’s rally has diminished over time, according to seasonality
Traditionally, stock market indices are expected to rally in December – a seasonal tendency known as ‘Santa's rally’. And that was generally the case for the Nasdaq 100 if we look back at the past 30 years, as it generated an average return of 0.7% in the month of December. Yet that positive expectancy has diminished in recent years, dropping down to 0.3% over the past 15 years, -0.6% over the past 10 and -1.3% over the past 5. Over the past 30-years the index has also closed lower 53.3% of the time.
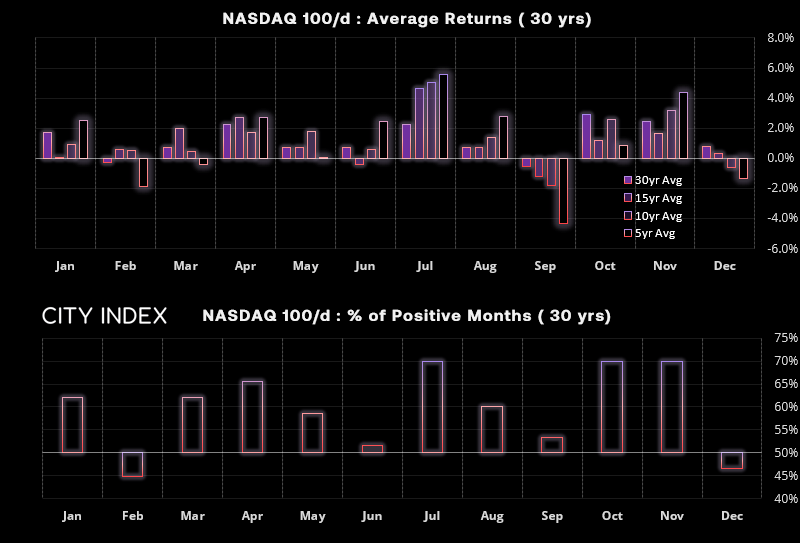
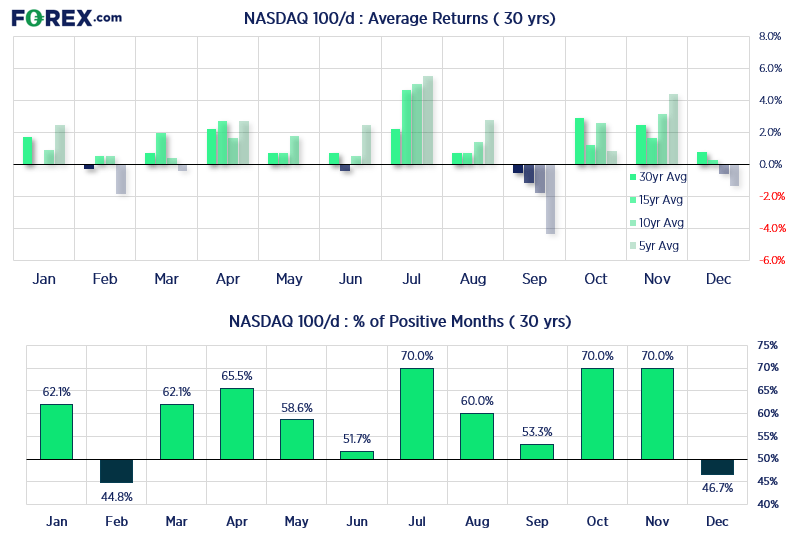
These number paint a bleak picture for December overall, and makes us question why there’s so much hype behind Santa’s rally. Yet with that said, these are also blunt numbers which look at the month overall. And context also matters.
However, the Nasdaq has already seen a strong pullback this month
At the time of writing, the Nasdaq has fallen ~35% since its record set 13-months ago, it’s down nearly -8% month to date, and fallen nearly -10% over the last 5 days alone. Shorting the index is not a new idea, and most importantly Wall Street held above key support levels yesterday despite extreme volatility in yesterday’s Asia session dye to the BOJ’s policy tightening. If markets can’t drop on bad news, it can be a prelude to a rally.
There are some technical clues that a bounce (at the minimum) could be due
If we look at some technical indicators for the Nasdaq, there are some reasons to be hopeful of a countertrend bounce.
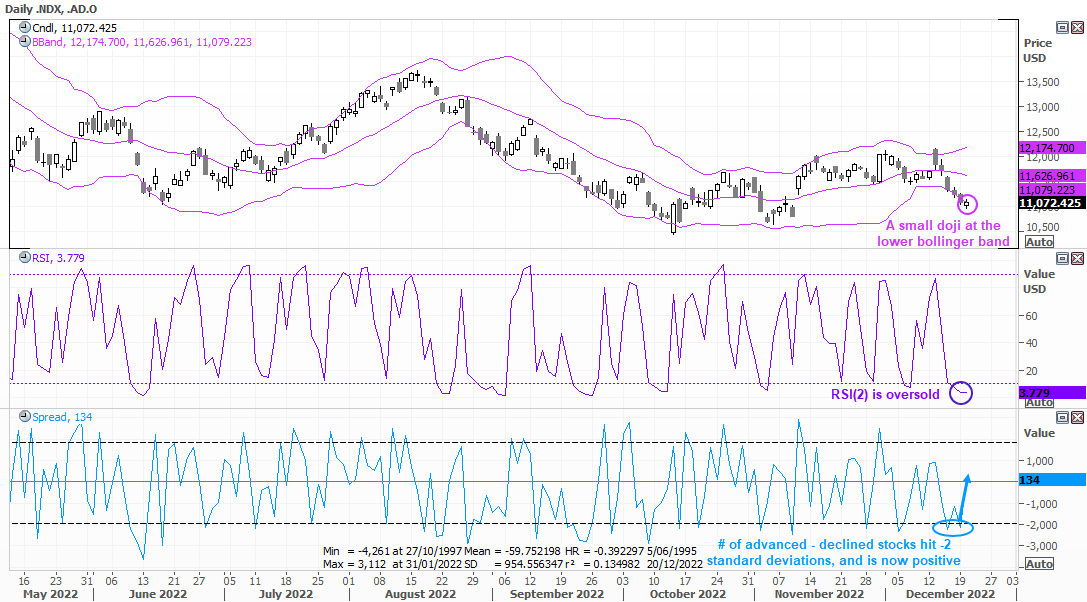
- RSI (2) is oversold: I use this indicator for near-term sentiment, with 10 or below marking oversold and 90 or above marking overbought. Currently sis at its most oversold level since September of 3.8.
- A-D line is positive: This simply indicator subtracts the daily number of declining stocks for, advancing stocks, for the New York stock exchange. Not only did the exchange see 134 more advancing stocks than declining yesterday, but the index twice fell below 2x standard deviations – which is a form of oversold. Whilst it is not a perfect timing too, it can warn of over-extension to the downside.
- Testing the lower Bollinger band: A small bullish candle (Doji) formed at the lower Bollinger band yesterday to warn of an oversold condition. We need to be a little careful here as such things happen during strong trends. Ut against the backdrop of a ‘bad news day’ following a steep decline, this candle could be more bullish than its size lets on.
- Doji at a support zone: The pullback from this month’s high has stalled at trend support and the June and September lows (the weekly pivot point is also just beneath here.
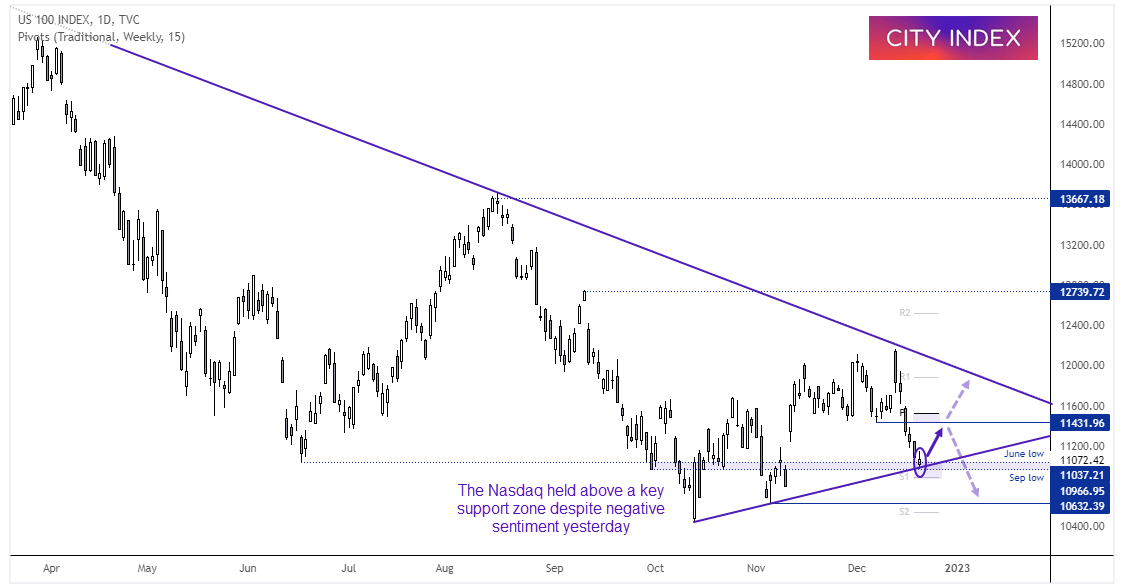
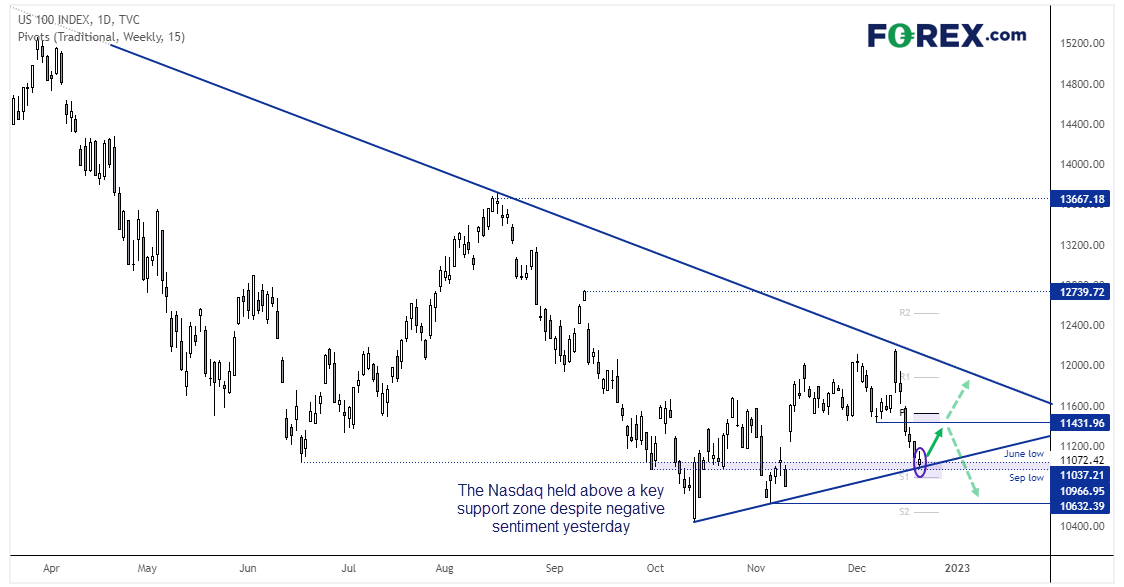
If we put all the pieces together, we favour a corrective bounce from current levels over the near-term – even if only to the 11,430 lows. As we have year-end flows then it also increases the odds of some unpredictable price action, but with such a strong pullback already the path of least resistance could be higher as we head towards Christmas, with a break to new highs being a bonus.
- Today’s bias is bullish above yesterday’s low and for a break above 11,200, with an initial target around 11,400.
- A break beneath the weekly S1 pivot assumes bearish continuation and a mover towards 10,600.
How to trade with FOREX.com
Follow these easy steps to start trading with FOREX.com today:
- Open a Forex.com account, or log in if you’re already a customer.
- Search for the pair you want to trade in our award-winning platform.
- Choose your position and size, and your stop and limit levels.
- Place the trade.
How to trade with City Index
You can trade with City Index by following these four easy steps:
- Open an account, or log in if you’re already a customer
• Open an account in the UK
• Open an account in Australia
• Open an account in Singapore
- Search for the market you want to trade in our award-winning platform
- Choose your position and size, and your stop and limit levels
- Place the trade
Related tags:


Open an account in minutes
Experience award-winning platforms with fast and secure execution.
Economic calendar
Web Trader platform
Our sophisticated web-based platform is packed with features.
Related articles
China's steel slump leaves iron ore bulls under the pump
Iron ore has broken major support, threatening a return to the lows of 2022 as mounting evidence of weakness in China's steel sector reinforces the bearish outlook.

USD/JPY, AUD/JPY: Central Bank Divergence Creates Two-Way Risk
USD/JPY eyes a breakout above 160, while AUD/JPY faces further losses as Fed, RBA and BoJ interest rate expectations diverge.

S&P, Nasdaq Slide as NVDA, AI Worries Continue to Build
It was a busy weekend in the headlines as a campaign to bring back Jensen Huang atop NVDA gained steam, even with accusations of possible treason and a circular funding model that has started to raise questions.

StoneX Financial Ltd (trading as "FOREX.com") is an execution-only service provider. This material, whether or not it states any opinions, is for general information purposes only and it does not take into account your personal circumstances or objectives. This material has been prepared using the thoughts and opinions of the author and these may change. However, FOREX.com does not plan to provide further updates to any material once published and it is not under any obligation to keep this material up to date.
This material is short term in nature and may only relate to facts and circumstances existing at a specific time or day. Nothing in this material is (or should be considered to be) financial, investment, legal, tax or other advice and no reliance should be placed on it. No opinion given in this material constitutes a recommendation by FOREX.com or the author that any particular investment, security, transaction or investment strategy is suitable for any specific person.
The material has not been prepared in accordance with legal requirements designed to promote the independence of investment research. Although FOREX.com is not specifically prevented from dealing before providing this material, FOREX.com does not seek to take advantage of the material prior to its dissemination. This material is not intended for distribution to, or use by, any person in any country or jurisdiction where such distribution or use would be contrary to local law or regulation. For further details see our full non-independent research disclaimer and quarterly summary.