Beyond Meat (BYND)
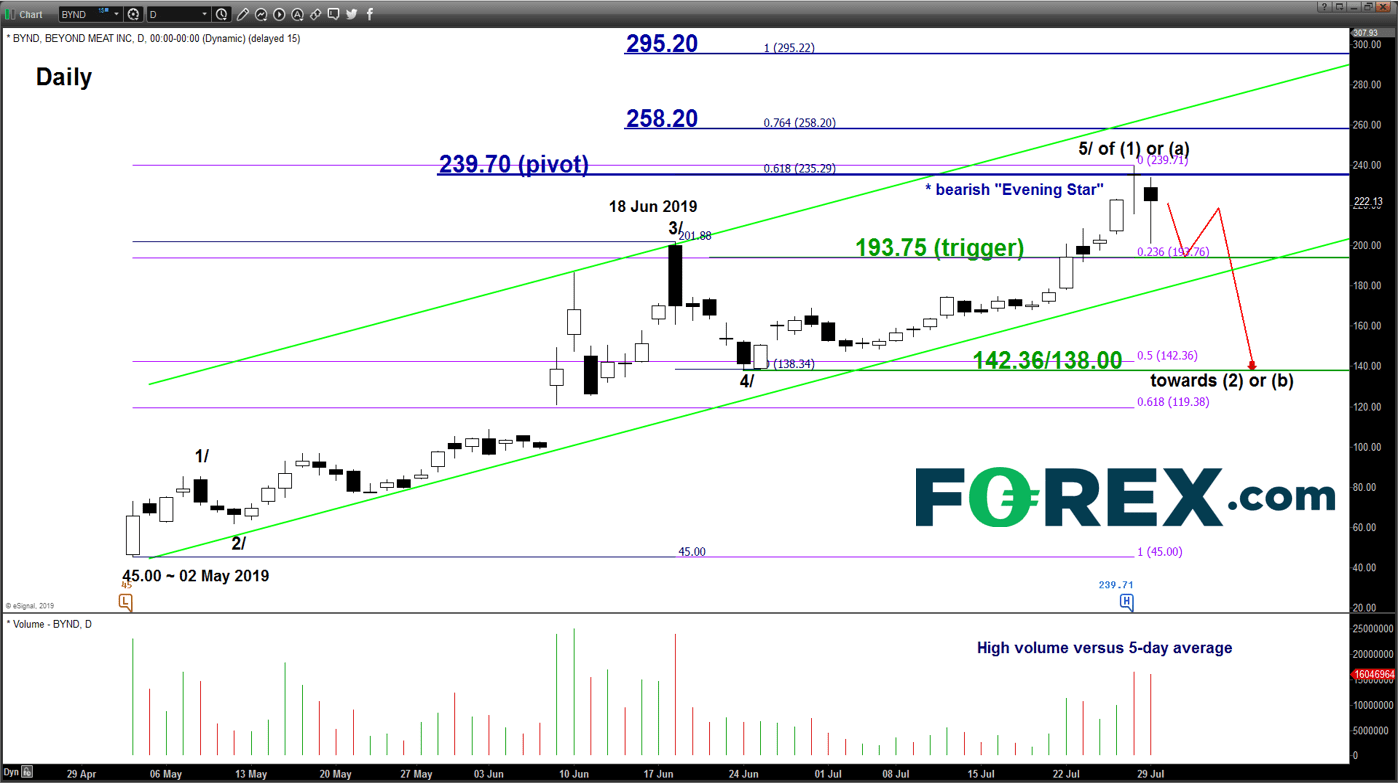
click to enlarge chart
Key elements
- Since our last report dated on 12 Jul, Beyond Meat (BYND) has rallied as expected and met the medium-term upside target/resistance of 258.20 as per highlighted (click here for a recap).
- It printed an intraday high of 239.71 on last Fri, 26 Jul. Thereafter, it has declined by 16% to print a low of 201.00 at the close of yesterday, 29 Jul U.S. session. After the close, BYND has reported better than expected revenue and reinforced its full-year outlook. However, it missed earnings consensus (-$0.24 EPS versus -$0.08 EPS). Also, it has announced a secondary stock offering just three months after is IPO. The share price of BYND continued to tumble by close to 12% in the after-hours session to print a low of 191.00.
- Last three days of price action since 25 Jul, BYND has formed a daily bearish “Evening Star” candlestick pattern right at the 239.70 key medium-term resistance.
- Interestingly, the 239.70 level is predetermined by a Fibonacci expansion level derived from Elliot Wave.
- Last two days of trading has been accompanied by higher volume which tends to be accompanied by a medium-term reversal in price action coupled with the bearish “Evening Star” candlestick pattern.
- Elliot Wave/fractal analysis has suggested that it may have completed the 5th wave impulsive upleg target, labelled as 5/ to complete entire medium-term bullish cycle in place since 02 May 2019 low. Thus, BYND is at risk now of shaping a significant correction of approximately 40% to retrace the prior bullish cycle.
Key Levels (1 to 3 weeks)
Pivot (key resistance): 239.70
Supports: 193.75 (trigger) & 142.36/138.00
Next resistances: 258.20 & 295.20 (Fibonacci expansion levels)
Conclusion
If the 239.70 key pivotal resistance is not surpassed and a break with a 4-hour close below 193.75 (also the ascending channel support) in the U.S. cash trading session is likely to trigger a potential multi-week corrective decline sequence to target the 142.36/138.00 support zone.
However, a clearance with a daily close above 239.70 invalidates the corrective decline scenario for an extension of the impulsive up move towards 258.20 and even 295.20 next.
Chart is from eSignal