Recent trading sessions have been positive for BTC price action. In the short term, over the last five sessions, Bitcoin has gained more than 6%, managing to break above the key psychological level of $70,000 per BTC.
Now, buying pressure has managed to hold, supported by a sense of temporary calm in global markets amid ongoing geopolitical tensions. However, it is important to note that key central bank decisions are still expected this week, which could impact the current bullish momentum and potentially trigger a new phase of indecision, similar to what was seen in previous weeks.

Is risk appetite for BTC returning?
Although markets remain exposed to tensions in the Middle East, a temporary sense of calm has started to emerge, as worst-case scenarios have not materialized. There has been no full closure of the Strait of Hormuz, nor a collapse in global oil supply, especially after the IEA announced the release of 400 million barrels from reserves.
This development has pushed WTI crude oil prices lower from the $100 level, contributing to improved stability in financial markets and supporting the attractiveness of risk assets such as Bitcoin in the short term.
This improved sentiment is also reflected in BTC market metrics. In the Bitcoin ETF segment, there has been a steady inflow of capital since March 9, with inflows exceeding $180 million on March 13, and no significant outflows in recent sessions. This points to increasing institutional participation and stronger demand for the asset.
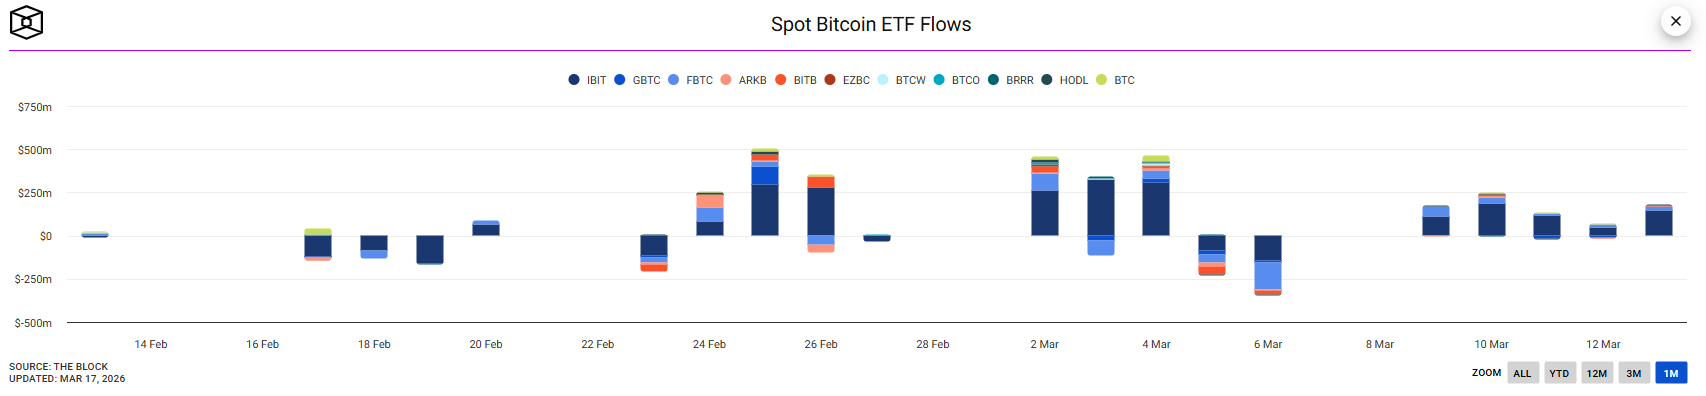
Source: Theblock
Additionally, Open Interest has shown consistent growth, surpassing $23 billion, levels not seen since early March. This indicator, which measures total open positions in the market, shows a strong upward slope, suggesting that the increase in activity may be linked to a rise in long positioning, especially as BTC prices have moved higher alongside the indicator.
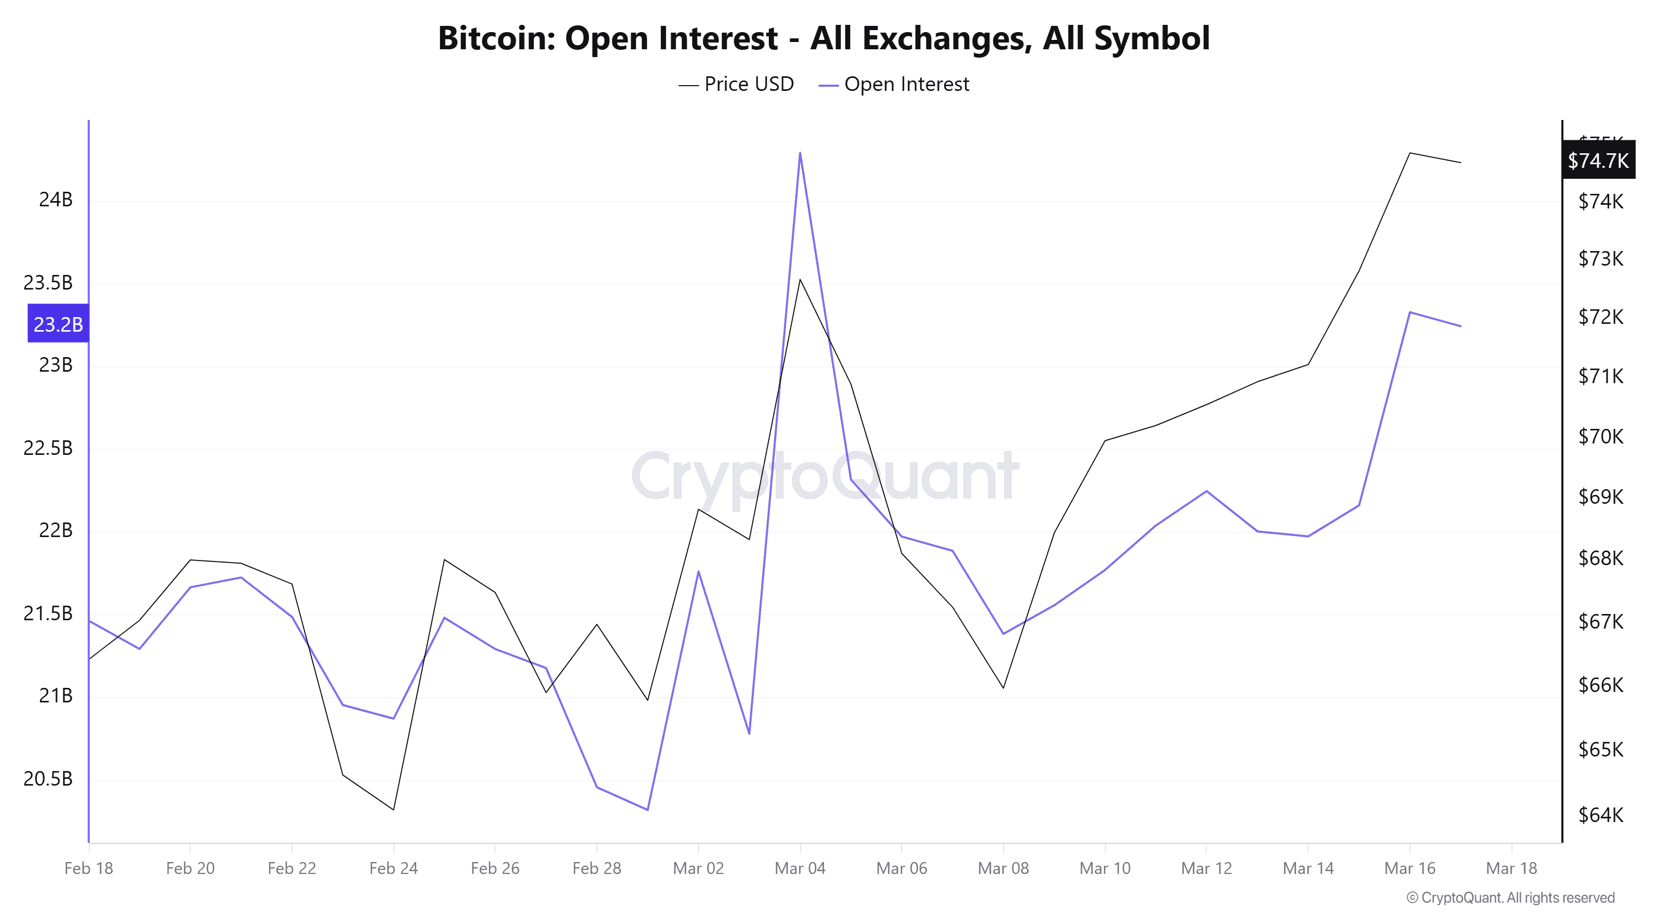
Source: Cryptoquant
Bitcoin appears to be benefiting from a consistent inflow of capital in recent sessions, partly driven by improved risk appetite. However, this dynamic could prove temporary, depending on whether the current sense of market calm persists in the short term.
Do central banks matter?
Another key factor to consider is this week’s central bank decisions, including those from the United States, Canada, Europe, Japan, and the United Kingdom. This could once again bring attention to one of Bitcoin’s main competitors: the bond market.
In recent weeks, it has been observed that when U.S. 10-year Treasury yields rise significantly, other markets, including cryptocurrencies, tend to lose attractiveness. Currently, yields have declined toward the 4.2% level from around 4.3%, reflecting some weakness in the bond market and allowing assets like BTC to recover ground in the short term.
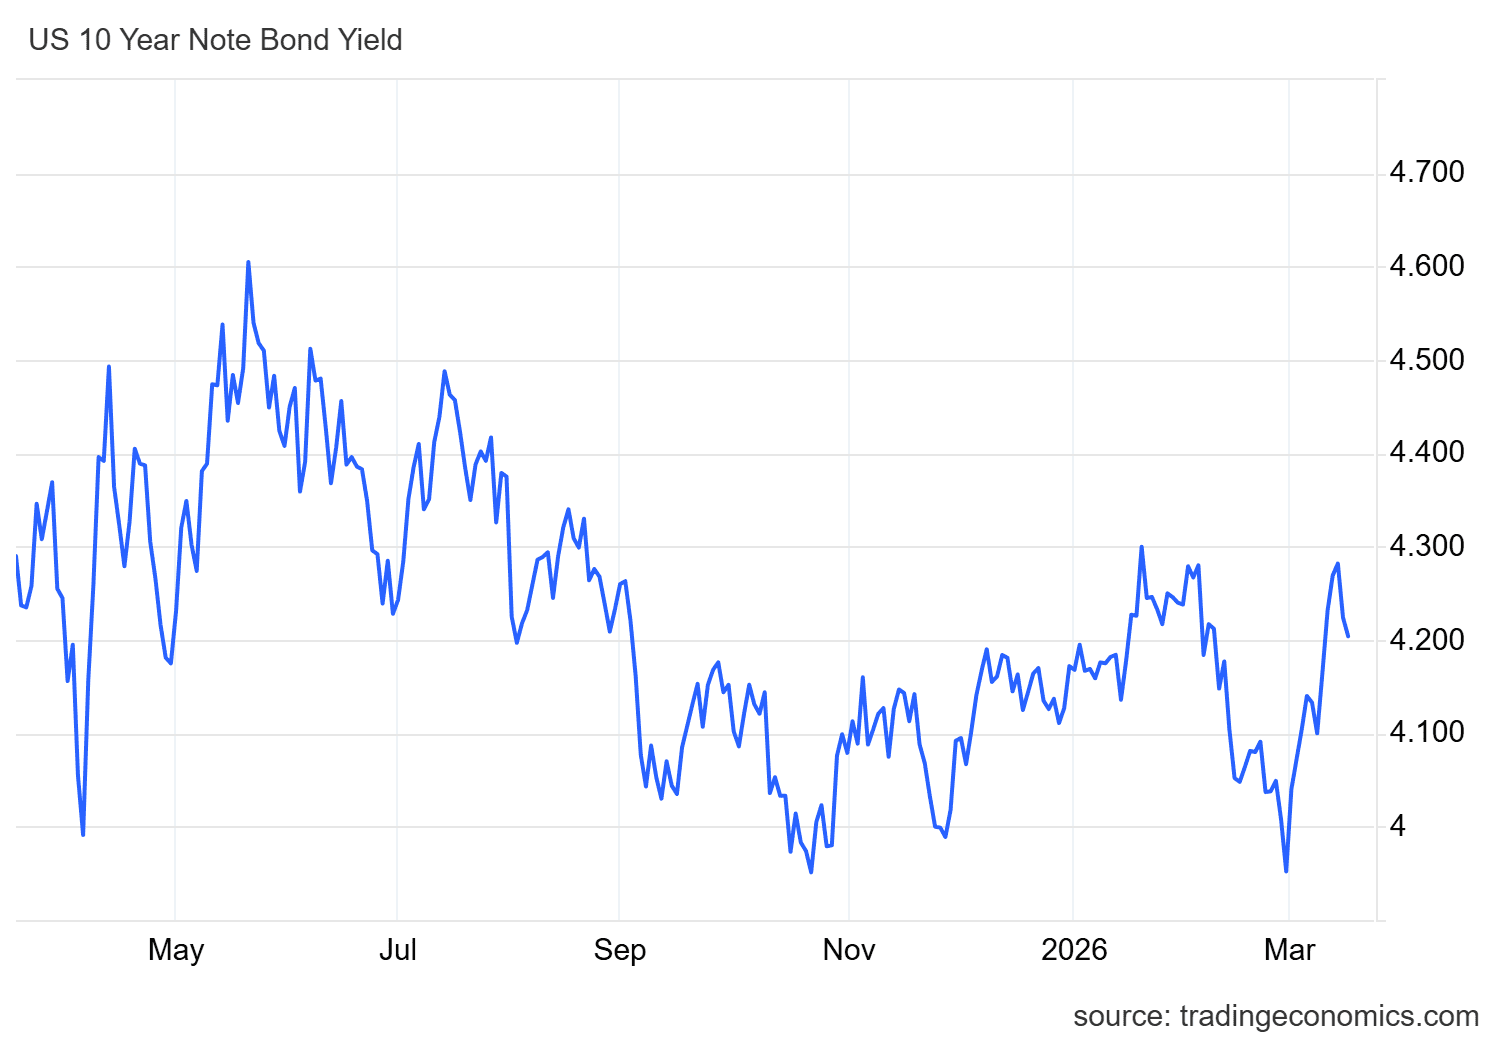
Source: Tradingeconomics
However, this dynamic could shift in the coming sessions. If central banks adopt a more restrictive or aggressive tone, this could drive yields higher again, restoring the appeal of bonds. In that scenario, Bitcoin could face renewed downward pressure due to reduced relative attractiveness, potentially losing part of its recent bullish momentum.
Bitcoin Technical Outlook
Source: StoneX, Tradingview
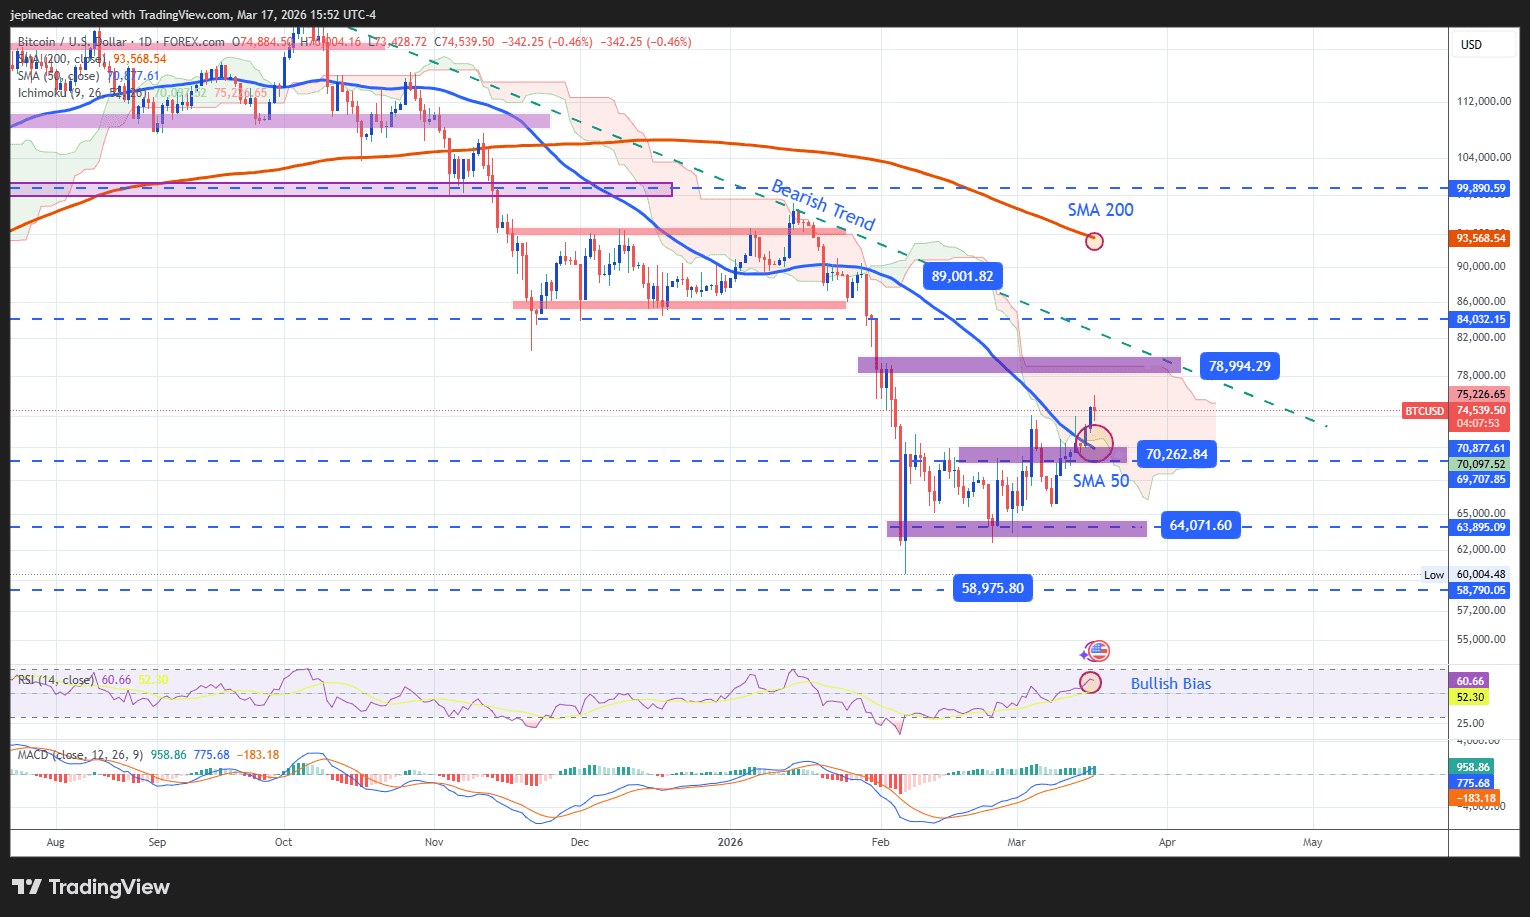
- The recent recovery is still not enough to break the downtrend: Despite the recent rebound, bullish price action has not yet invalidated the downtrend line that has dominated the chart for several months. From a structural perspective, this descending trend remains the most relevant pattern, maintaining a bearish bias in the long term. That said, buying pressure has managed to break through some key resistance levels. If this momentum holds in the coming sessions, it could begin to challenge the current bearish structure.
- RSI: The RSI indicator remains above the 50 level, suggesting that buying momentum is still present. However, the indicator has started to flatten, which may signal a neutral phase and potential indecision if this behavior persists.
- MACD: The MACD shows a similar pattern, with the histogram remaining above the zero line, but also flattening in the short term. This suggests that bullish momentum may be losing strength, reinforcing the possibility of a consolidation or indecision phase.
Key levels:
- 78,900 – Key resistance: A previous neutrality zone that aligns with the main downward trendline. A break above this level could trigger a structural shift, opening the door for a more dominant bullish bias in the coming weeks.
- 70,200 – Near-term barrier: A key psychological level that also aligns with the 50-period moving average. Failure to move decisively away from this level could lead to a renewed indecision phase, limiting bullish continuation.
- 64,000 – Major support: A zone aligned with recent lows and the main downside level to monitor. Sustained moves toward this area could reactivate a bearish bias and extend the broader downtrend in the coming sessions.
Written by Julian Pineda, CFA, CMT – Market Analyst
Follow him on: @julianpineda25