


It’s been a painful six-week run in Bitcoin as a -35.69% sell-off took over. But, as the old saying goes, major tops or bottoms like to make themselves known, and the reaction around 85k last Friday has made a mark, and that has since led into a shift with prices now building back up to the 90k level.
There’s something for everyone here – if you’re bearish Bitcoin, we have a big resistance level in-play with more context a little higher. If you’re bullish, there’s now short-term structure of higher-highs and higher-lows to work with. Both sides are analyzed in this article.

Bitcoin hasn’t experienced a drawdown of this magnitude since the 2021 top, which led to a massive -77.57% retracement that ultimately bottomed just about three years ago. Interestingly, that low came in after capitulation from the selling around the FTX fiasco, and it took some time, but bulls slowly but surely got back in-charge.
It was the risk on mood of 2023 that helped massively and that helped BTC to get up to 70k, which is right around where it had stalled previously in 2021. But the election of Donald Trump as US President drove a parabolic trend that finally allowed the cryptocurrency to push above the 100k threshold.
Thickening the plot is the correlation that’s shown of recent between stock markets and Bitcoin, with the Nasdaq’s recovery this week, following a test of lows last Friday, mirroring that of Bitcoin. BTC/USD came very close to touching the 80k psychological level, but buyers showed up early, helping to build support around 85k. And in the three days so far this week, that’s led to a short-term sequence of higher-highs and lows.
BTC/USD Daily Chart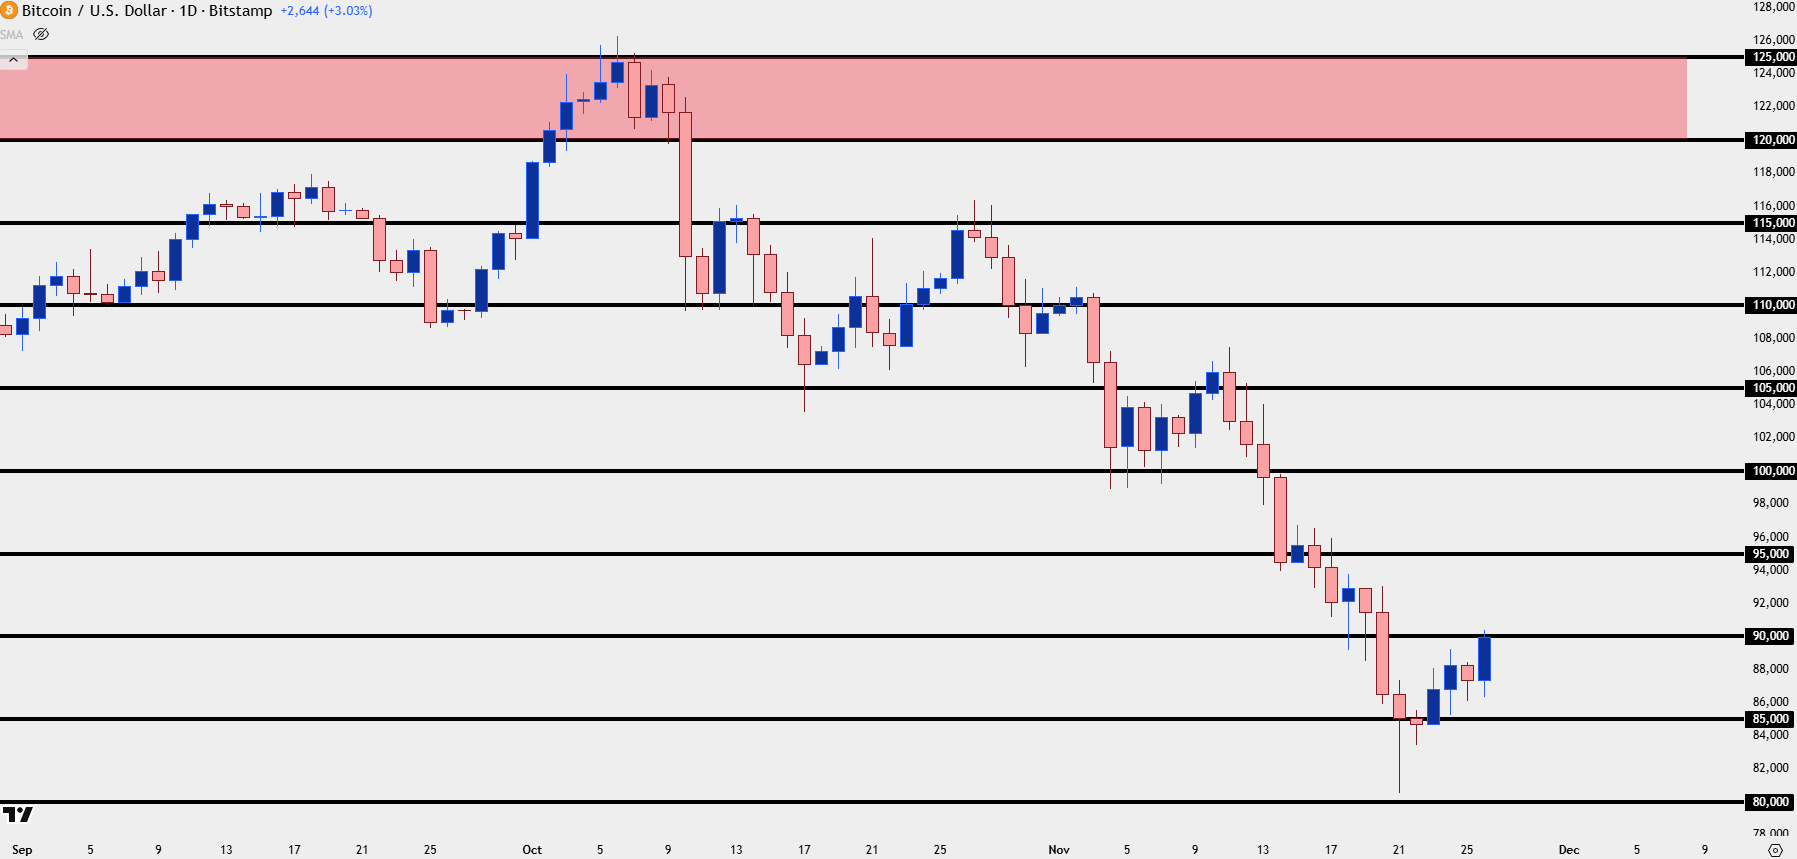
Chart prepared by James Stanley; data derived from Tradingview
BTC/USD for Bears
If bearish on Bitcoin, there’s now a bounce that could start to show attraction for selling into, and a hold of the 90k psychological level would be an attractive first step to such a thesis. But, even if the short-term rally continues, there’s more context for lower-high resistance given that the last swing high was all the way up at 107,465.
From the four-hour chart below we can already see 90k seeing some selling pressure, although its still early in that process; but above that is a spot of support-turned-resistance at 92,929 and that’s followed by a 100k level that showed support a couple of different times before sellers ultimately were able to drive the trend below it; and it was that bounce that built into the recent lower-high at 107,465.
But because 100k is such a massively important level, this also places importance at 95k, as ideally for bears, there would be an element of bearish anticipation that would bring selling pressure in before price could move up to the big figure at $100,000.
I would consider invalidation at this point with a push beyond 107,465 which would take out the most recent lower-high from the daily chart.
BTC/USD Four-Hour Chart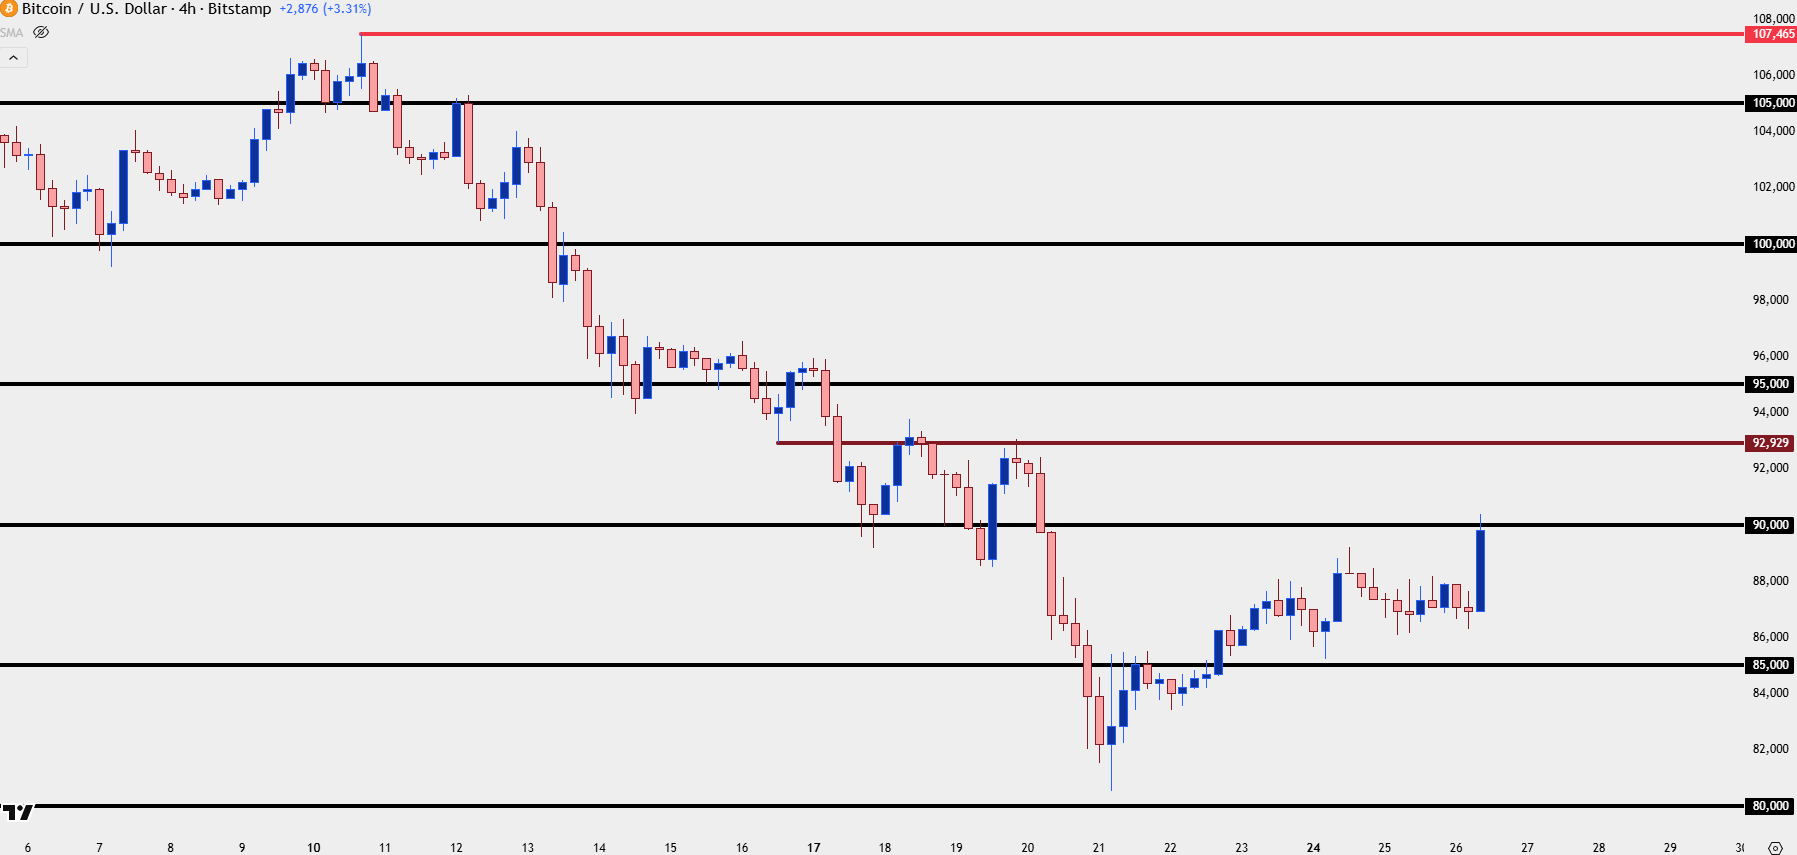
Chart prepared by James Stanley; data derived from Tradingview
BTC/USD Shorter-Term
The bounce hasn’t quite been building for a week but it’s the recent progress that is perhaps most encouraging. Initially, 85k held highs on Friday but over the weekend sellers showed fatigue, allowing for higher-lows to build that, eventually, led to breakout.
The initial move past 85k wasn’t exactly a burning trend higher, but after a check back for support of prior resistance, buyers have been putting in work to allow for the 90k re-test, and this, at the least, can provide some bullish short-term structure for traders to work with if they do want to push the long side of Bitcoin.
I’m currently tracking two support zones of note, one aggressive and one more conservative. The aggressive zone in aqua below is another spot of support-turned-resistance, and this runs from previous swing lows at 88,523 up to 89,189. If buyers are aggressive, then that’s the spot that they would ideally defend to allow for another test and then, eventually a possible break and rally beyond the 90k level.
A bit deeper we have that prior resistance from a week ago, from 85k up to 85,409, and if buyers can’t defend that, then this entire bounce is going to look like it was largely just a short-covering rally.
For the bullish scenario, a breakout beyond 90k then opens the door for test of prior support-turned-resistance at 92,929 after which 95k and then 100k come into the picture.
BTC/USD Two-Hour Price Chart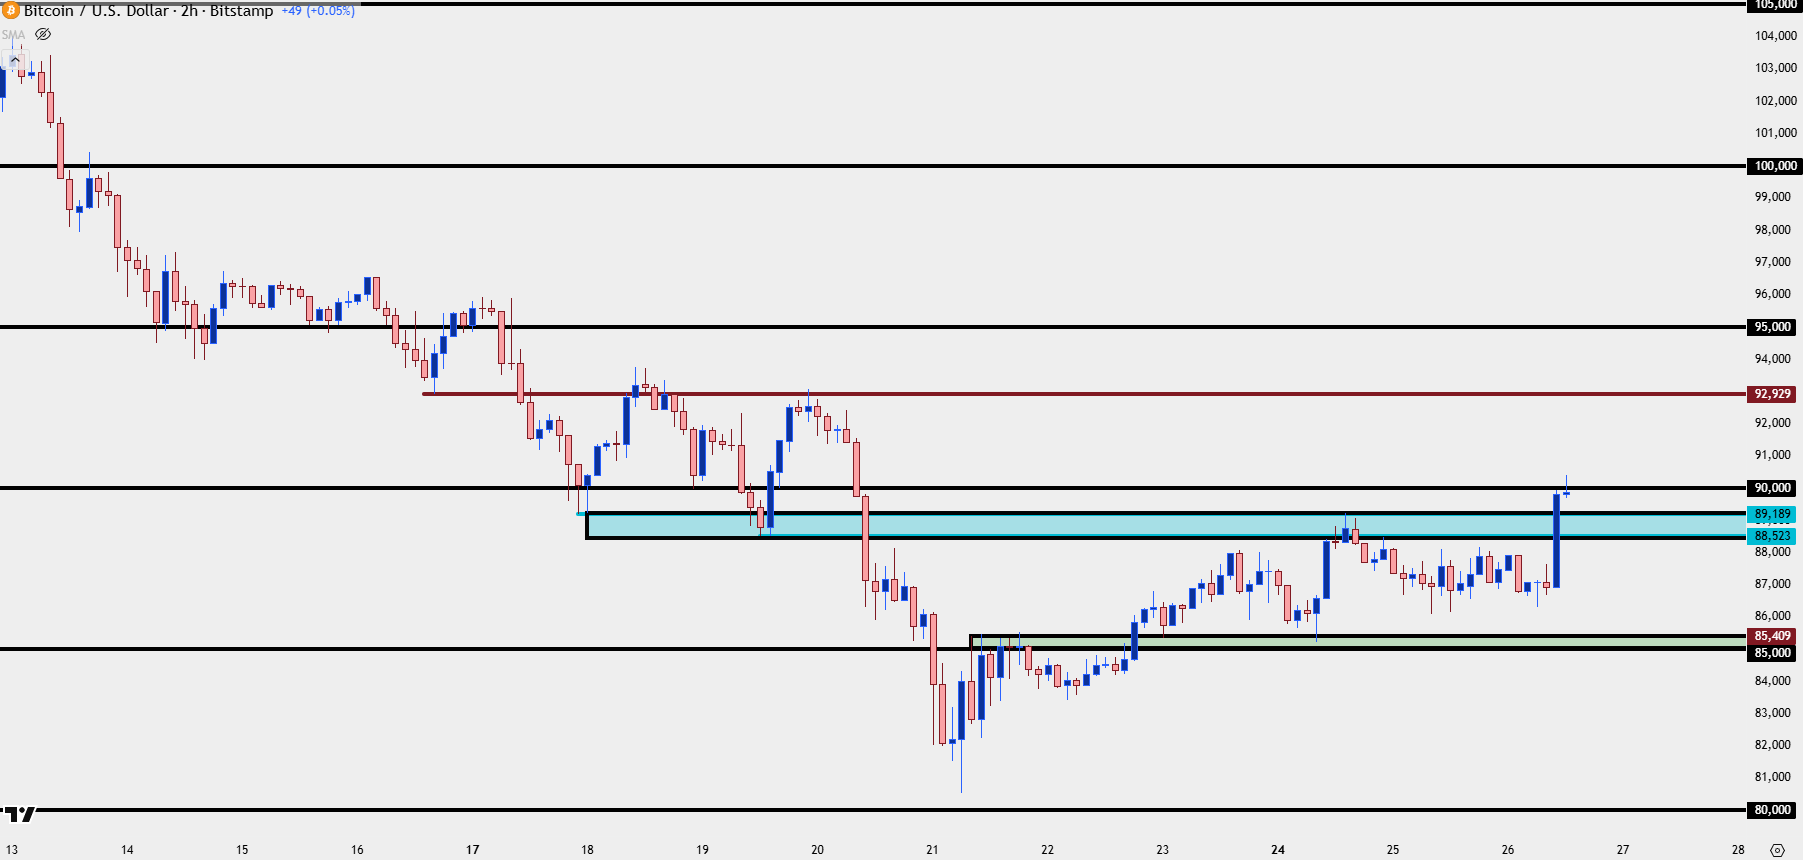
Chart prepared by James Stanley; data derived from Tradingview
--- written by James Stanley, Senior Market Analyst, Global Macro






