


Crude oil prices opened the week on a bullish note after OPEC+ decided to pause its output hikes in Q1 2026. The decision, combined with the US–China trade truce, has helped stabilise sentiment and reinforce expectations of improving global growth. With WTI crude holding firm above $60, traders are watching for further confirmation of recovery momentum amid rising yield spreads and improving market breadth.
View related analysis:
- The Nasdaq-to-Bitcoin Correlation Is Alive and Well (During Risk-Off)
- Gold Shows Tentative Signs Of Stability, Options Hint At Mild Recovery
- Australian Dollar Outlook: RBA, US ISM and ADP In Focus
- US Dollar Eyes Breakout as EUR/USD, GBP/USD Probe Support, USD/JPY Rallies
OPEC+ Output Pause and Trade Truce Lift Oil Market Sentiment
OPEC+ Output Pause and Trade Truce Lift Oil Market Sentiment
Crude oil prices gapped higher at the weekly open after OPEC+ decided to pause their output hikes in Q1 2026. They agreed to raise output by 137k barrels per day in December, matching their pace for October and November. With the US and China’s trade truce, it bodes well for global growth expectations and could provide the bullish catalyst required for crude oil bulls.
Rising US 2–10 Yield Spread Could Support Further Oil Gains
The US 2–10-year spread can be indicative of growth expectations. It’s interesting to see that it is beginning to curl higher, even though it has effectively been ranging sideways since April. However, if crude oil traders are to expect any meaningful rally, they’d likely want to see the 2–10 spread continue higher and break out. For now, WTI crude oil prices are hinting at a minor bounce over the near term at a minimum.
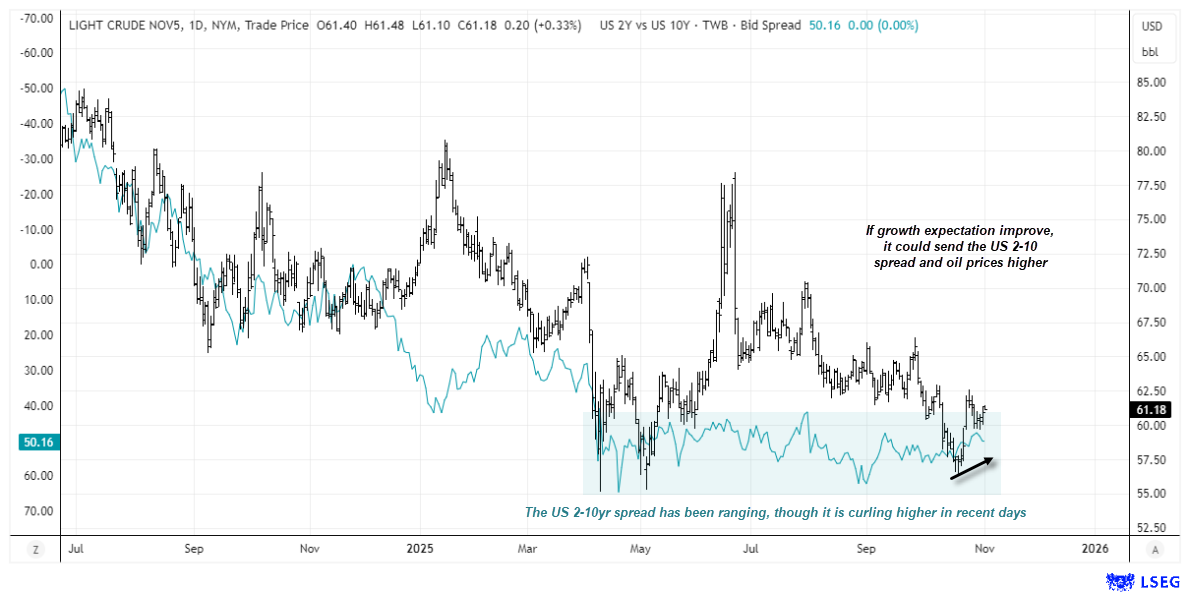
Chart analysis by Matt Simpson, Source: TradingView, ICE Futures, WTI Crude Oil
WTI Crude Oil Futures (CL) Technical Analysis
October delivered a solid bullish reversal in the second half of the month, leaving a prominent bullish hammer on the monthly chart. While oil prices have effectively been trading sideways in a choppy range for the past couple of years, this still allows for decent upside potential on the daily and weekly timeframes.
Notably, WTI crude oil snapped a three-week losing streak with a bullish engulfing candle, marking its best week in 20. This suggests an important swing low has formed around $56.
The daily chart shows that prices gapped higher from around $58 to above $60 last week — a pivotal level in prior months. Prices have since shown signs of stability above this key level, and momentum is turning higher thanks to a three-day bullish streak from crude oil traders.

Bulls may look for dips within Friday’s range in anticipation of a breakout above the $62.59 high. This could also improve the potential risk-to-reward ratio, as the 200-day EMA ($62.04) and October VPOC ($61.65) are likely to act as initial resistance.
A break above the $62.60 area opens up the potential for a run toward the highs just below $66. Whether WTI crude oil bulls can expect a retest or breakout of these levels will likely depend on growth expectations — and how the US 2-10 yield spread behaves.
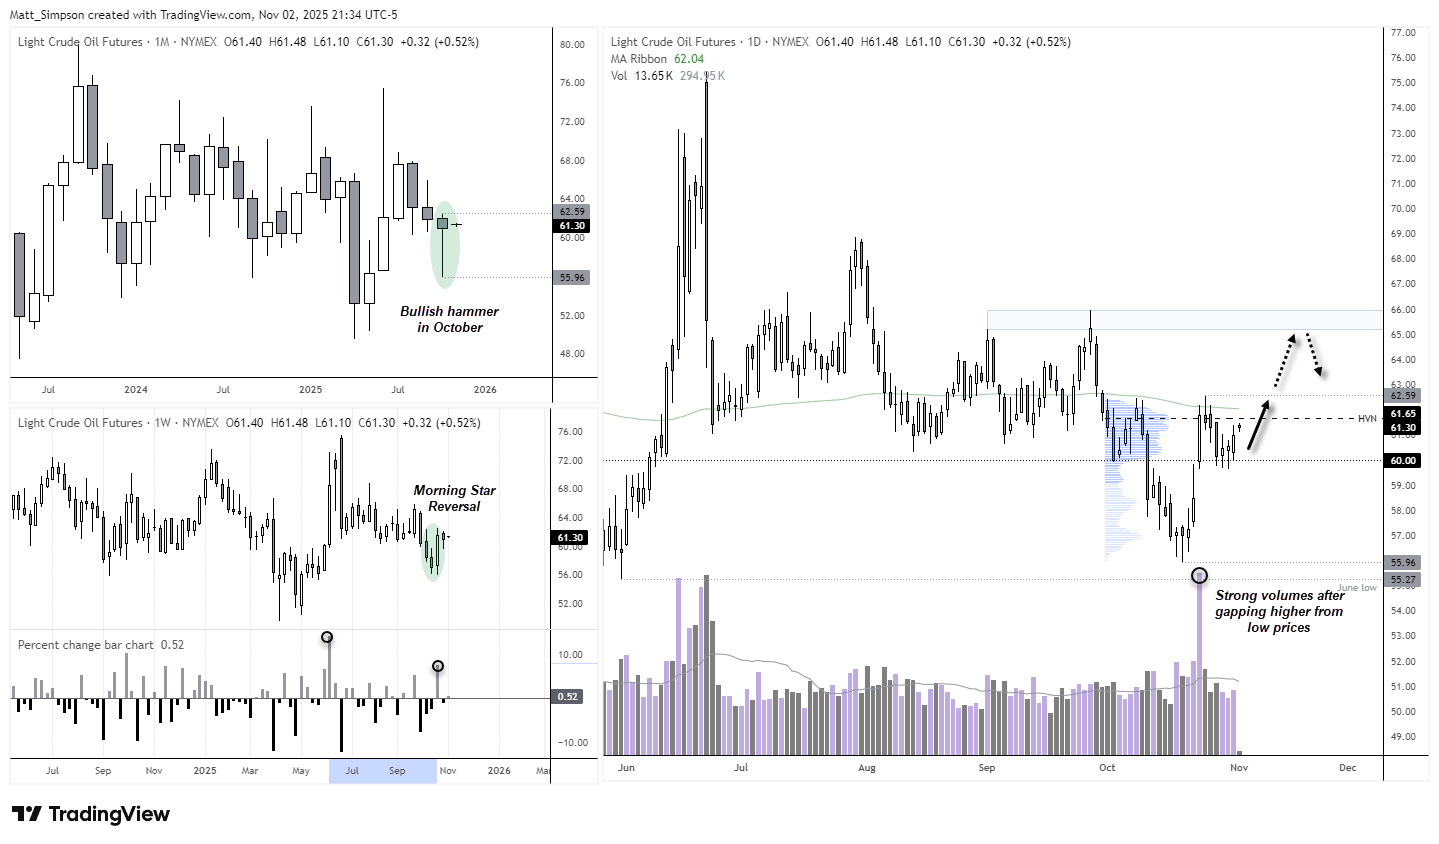
Chart analysis by Matt Simpson, Source: TradingView, ICE Futures, WTI Crude Oil
View the full economic calendar
-- Written by Matt Simpson
Follow Matt on Twitter @cLeverEdge






