
With just one week remaining before October comes to an end, the cryptocurrency market continues to struggle to regain consistent demand. Although some assets have experienced notable price movements in recent sessions, the broader market still lacks a clear short-term direction. Major cryptocurrencies continue to trade within a pattern of repeated rebounds without being able to break through key technical barriers, a situation that is gradually giving way to increasingly well-defined consolidation ranges.
For now, the lack of momentum remains one of the market's dominant characteristics and, unless prices begin to break important technical levels, the current phase of indecision could continue to be one of the most relevant factors shaping cryptocurrency price action in the coming sessions.

Performance of Major Cryptocurrencies
Source: Data - StoneX, Tradingview
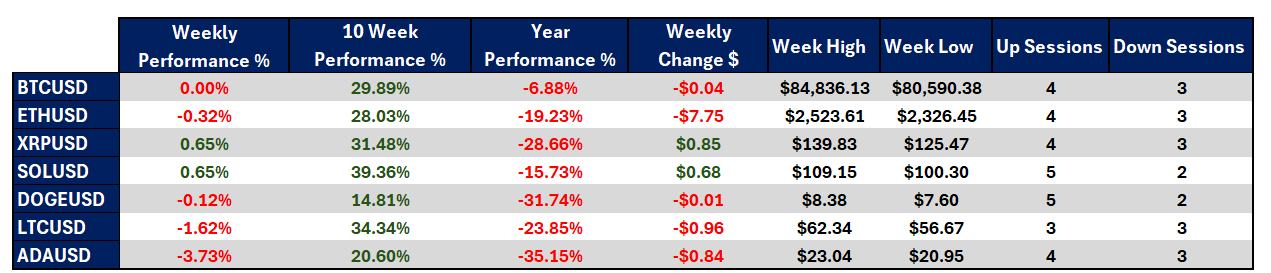
- The week has not been particularly favorable for the cryptocurrency market. Overall, a neutral tone continues to dominate, with even Bitcoin, the market's benchmark asset, failing to sustain meaningful bullish momentum. In this environment, Cardano stands out after posting a weekly decline of approximately -3.73%, making it one of the weakest performers among the major cryptocurrencies. In contrast, much of the market has recorded very limited price action, with several assets showing changes close to 0.0% between last week's close and this week's close. This continues to highlight an increasingly evident lack of direction, as major cryptocurrencies remain unable to break key levels capable of generating a more structured trend in the short term.
- Looking back over the last 10 weeks, the picture remains somewhat more constructive, as most assets continue to trade above the levels seen several weeks ago. This suggests that a medium-term bullish bias is still present. In this context, Solana stands out with gains exceeding 39.36%, while Dogecoin continues to post advances close to 15%. However, these gains have gradually begun to moderate, reflecting a loss of momentum in buying activity and supporting a consolidation phase that is becoming increasingly relevant across the market.
- The yearly performance continues to be one of the sector's main challenges. Major cryptocurrencies remain below the levels observed at the beginning of 2026, highlighting the lasting impact of the weakness seen during the first months of the year. Cardano remains one of the most affected assets, posting declines of approximately -35.15%, while Bitcoin is down close to -6.88%. What stands out is that BTC remains one of the cryptocurrencies closest to recovering a positive annual performance, while a large portion of the market continues to trade with negative returns and time is gradually running out for 2026 to become a positive year for the crypto sector.
- Bitcoin, as the leading cryptocurrency, has also struggled to rebuild strong market confidence during the week. Price action has remained largely unchanged compared to last week's close and has failed to consistently break above the key $80,000 and $85,000 reference zones. This continues to reflect one of the most important periods of indecision for the cryptocurrency this year and suggests that part of the market's attention may currently be focused on other asset classes.
- Overall, the market remains trapped between caution and indecision. The buying momentum that dominated previous weeks has lost intensity and, for now, even Bitcoin has been unable to provide enough confidence to the broader sector. As long as this lack of momentum remains a defining characteristic, caution could continue to shape much of the market's behavior during the sessions ahead.
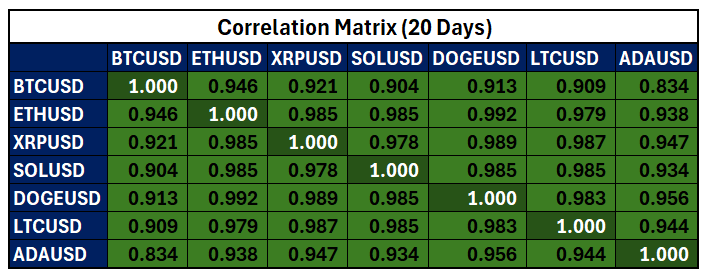
Colors from red to green. Red for negative correlations and green for positive correlations.
Source: Data - StoneX, Tradingview
From a correlation perspective, there continues to be an increasingly evident alignment between the performance of major cryptocurrencies and Bitcoin. Correlation coefficients have increased compared to previous weeks, and many assets are now trading with correlations above 0.8, highlighting how closely a large part of the market is following the behavior of BTC. It is important to remember that these coefficients can change over time.
This remains relevant because Bitcoin itself continues to trade without a clear directional bias. As the broader market becomes more closely aligned with the benchmark cryptocurrency, the lack of momentum in BTC increasingly spills over into the rest of the sector. This suggests that the caution currently observed is no longer isolated to specific assets but has become a broader characteristic of the crypto market. Unless Bitcoin develops stronger directional moves capable of improving overall market confidence, this phase of neutrality could remain relevant in the coming sessions.
Bitcoin Begins to Trade Within a Relevant Consolidation Range
Source: StoneX, Tradingview
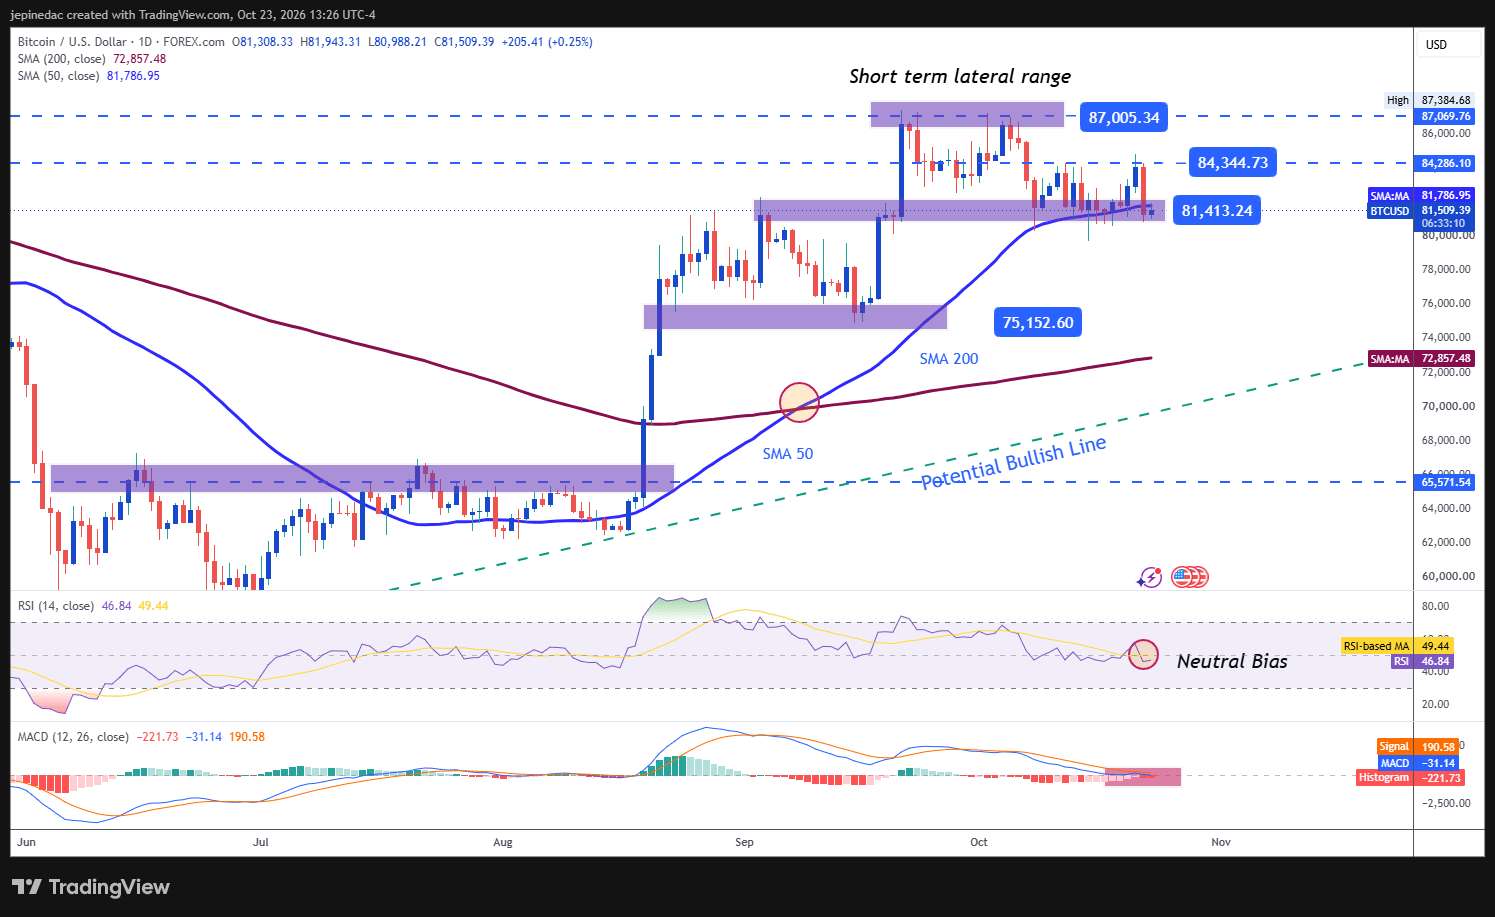
As the leading cryptocurrency, Bitcoin continues to post a week of limited price fluctuations while remaining trapped between key technical barriers. Although the market attempted to consolidate a medium-term bullish structure in previous weeks, recent price action has increasingly reflected a consolidation phase that has gradually evolved into a relatively well-defined trading range. This has become the most relevant technical structure to monitor in the short term. Unless price breaks through important barriers, it remains difficult to talk about either a solid recovery or a clearly defined trend.
Indicators:
- Both the MACD and the RSI continue to trade near their respective neutral zones. This reflects a relatively balanced environment between buyers and sellers, as well as a lack of clear direction within short-term moving averages. As a result, the possibility that a phase of indecision continues to dominate market behavior remains relevant in the coming sessions.
Key Levels:
- $87,000 – Key Resistance: Recent highs continue to define the most important upside barrier on the chart. A sustained move above this level could bring buying momentum back into focus and reactivate the broader bullish structure observed in previous months.
- $84,300 – Near-Term Barrier:A level that continues to act as an important equilibrium zone. Price action returning to this area without generating meaningful momentum could continue to support a phase of indecision and reinforce the current consolidation range as the dominant structure in the weeks ahead.
- $81,400 – Key Support: A level that corresponds to the most important lows recorded in recent weeks and also develops near the 50-period simple moving average. A sustained move below this area could signal a more consistent bearish bias, alter the current technical structure, and open the door to a more relevant short-term downtrend.
Ripple Is Also Facing a Lack of Trend
Source: StoneX, Tradingview
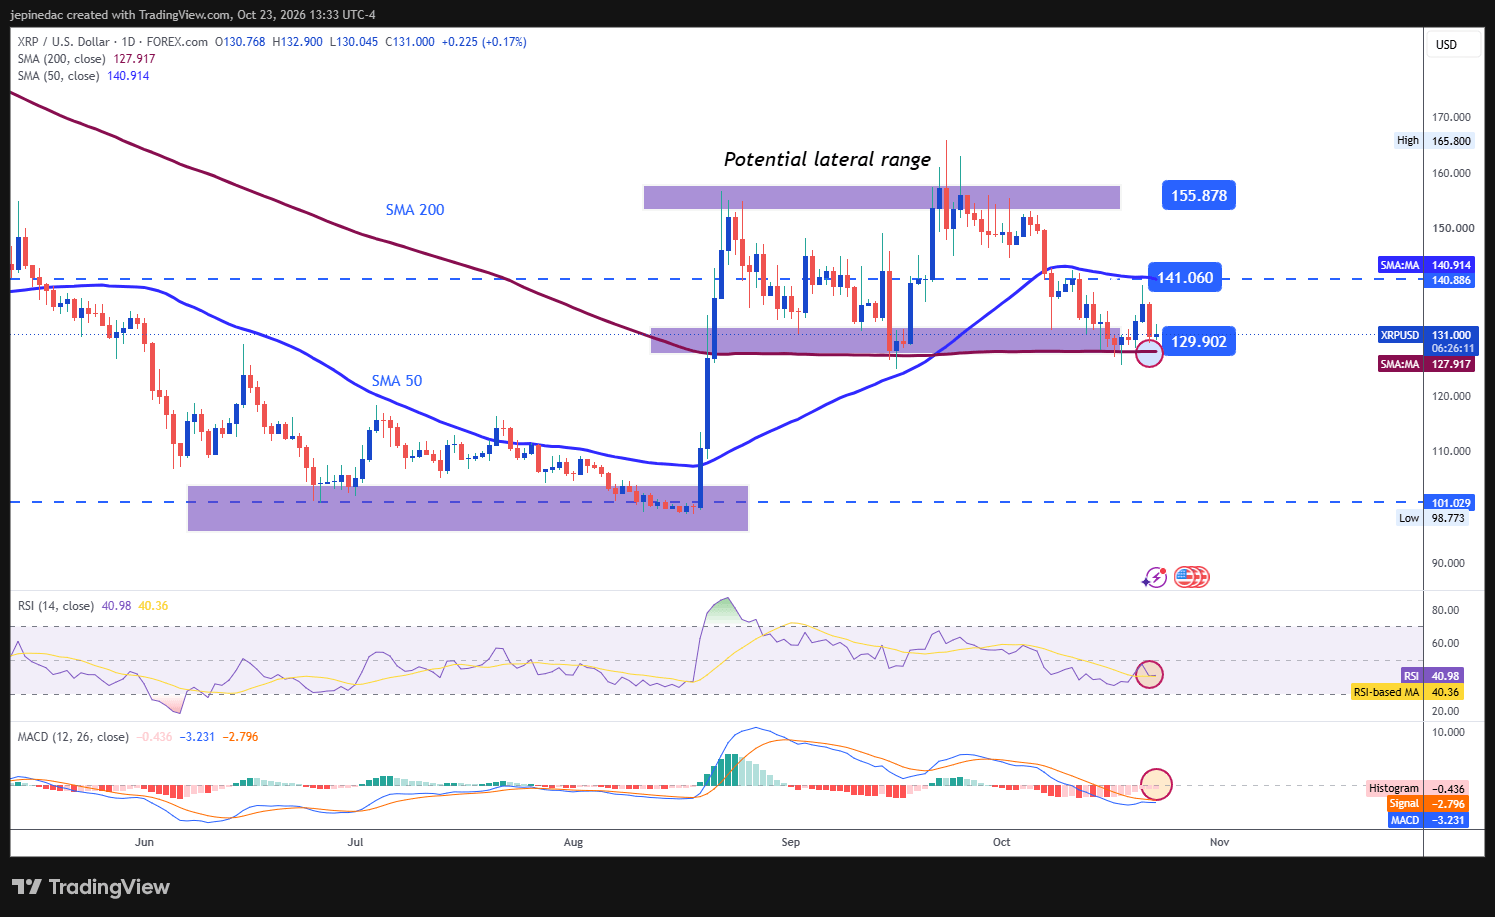
Ripple has also begun to display a significant lack of direction, a situation that has resulted in the formation of a medium-term trading range. For now, price action continues to fluctuate between clearly defined technical levels and, unless those barriers are broken, this range could remain the dominant structure to monitor in the weeks ahead.
Indicators:
- Both the RSI and the MACD histogram continue to develop near their respective neutral levels. This reflects a relatively balanced environment between momentum and moving-average strength. As long as this behavior remains in place, the current indecisive bias could continue to play an important role in Ripple's price action during the coming sessions.
Key Levels:
- 155.87 – Key Resistance: The upper boundary of the current trading range and the main barrier for bullish movements. A sustained break above this level could restore buying momentum and reactivate the bullish structure that attempted to develop several months ago.
- 141.06 – Near-Term Barrier: An equilibrium level that coincides with the 50-period simple moving average. Price action returning toward this area could continue to highlight the lack of direction and reinforce the relevance of the current consolidation range.
- 129.90 – Key Support: An important support area that coincides with the 200-period simple moving average and the base of the primary uptrend line. A move back toward this level could weaken the recovery observed in recent weeks and create room for more meaningful selling pressure, potentially giving way to a short-term bearish structure.
Written by Julian Pineda, CFA, CMT – Market Analyst
Follow him on: @julianpineda25