EUR/USD – Consolidation within bearish trend

click to enlarge chart
- The pair has continued to trade sideways within a minor “Symmetrical Triangle” range configuration in place since last Thurs, 25 Jul. Maintain bearish bias in any bounces below 1.1200 key short-term pivotal resistance for another potential downleg to target the next near-term support at 1.1060.
- On the other hand, a break with an hourly close above 1.1200 negates the bearish tone for an extension of the corrective rebound towards the 1.1280 key medium-term resistance (also close to the descending resistance from 10 Jan 2019 high).
GBP/USD – Potential minor corrective rebound

click to enlarge chart
- The pair has shaped the expected residual push down and almost met the downside target/support of 1.2100; printed a low of 1.2117 before it traded sideways (click here for a recap on our previous report).
- The hourly RSI oscillator has exited from its oversold region which has increased the odds of a minor corrective rebound coupled with Elliot Wave/fractal analysis. Flip to a bullish bias above 1.2100 key pivotal support for a potential bounce towards 1.2270 max 1.2320 intermediate resistance within a medium-term bearish trend in place since 13 Mar 2019 high.
- On the other hand, a break with an hourly close below 1.2100 invalidates the corrective rebound scenario for the continuation of the impulsive down move to target 1.2000/1950 next (Fibonacci expansion cluster & Oct 2016 low).
USD/JPY – Further potential push down within range configuration

click to enlarge chart
- No major changes on its key short-term elements; maintain bearish bias in any bounces below 109.00/109.20 key medium-term pivotal resistance for a push down to target the next near-term support at 108.00 in the first step.
- On the other hand, a break with a daily close above 109.20 invalidates the bearish scenario for a squeeze up towards 109.40/60 (30 May 2019 swing high area).
AUD/USD – Potential minor corrective rebound
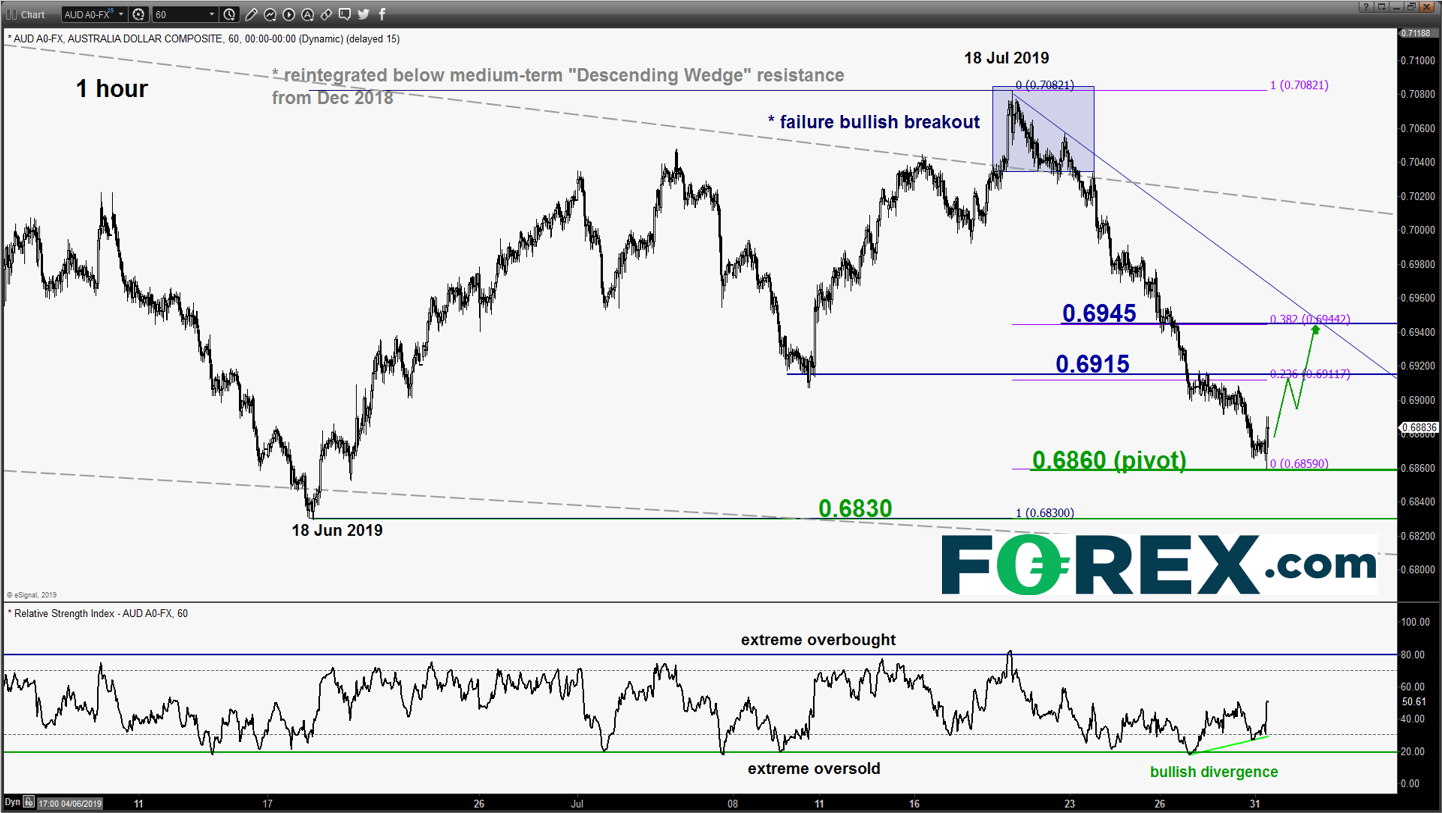
click to enlarge chart
- The pair has staged a push down to challenge the 0.6880 lower limit of the short-term neutrality zone as per highlighted in our previous report; it printed an current intraday low of 0.6860 in today’s Asian session before it rebounded and recorded an hourly close back above 0.6880.
- The hourly RSI oscillator has continued to post a bullish divergence signal at its oversold level despite marginal “lower lows” seen in price action. These observations suggest that the recent downside momentum has started to ease. Flip to a bullish bias above 0.6860 short-term pivotal support for a potential minor corrective rebound to target 0.6915 follow by 0.6945 within a major bearish trend in place since 03 Dec 2018 high.
- On the other hand, failure to hold at 0.6860 sees a further drop towards 0.6830 (also the Jan 2016 swing low area).
Charts are from eSignal