
Wall Street has come under renewed pressure as rising oil prices, higher bond yields and inflation concerns weigh on sentiment. The Dow Jones has led the decline, while the Nasdaq has held up relatively well despite a sharp deterioration in market breadth. That divergence could make Nasdaq support an important test of whether the sell-off broadens.
View related analysis:
- US Dollar Outlook: Technical Case for USD Bounce as PPI and CPI Loom
- EUR/USD Could Be Vulnerable to Another Dip with ECB In Focus
- ASX 200 Eyes Break of 8900 as Sector Weakness Builds
- Japanese Yen Outlook: MOF Riding BOJ, Fed Momentum?
Dow Leads Wall Street Lower While Nasdaq Defies Weakening Breadth
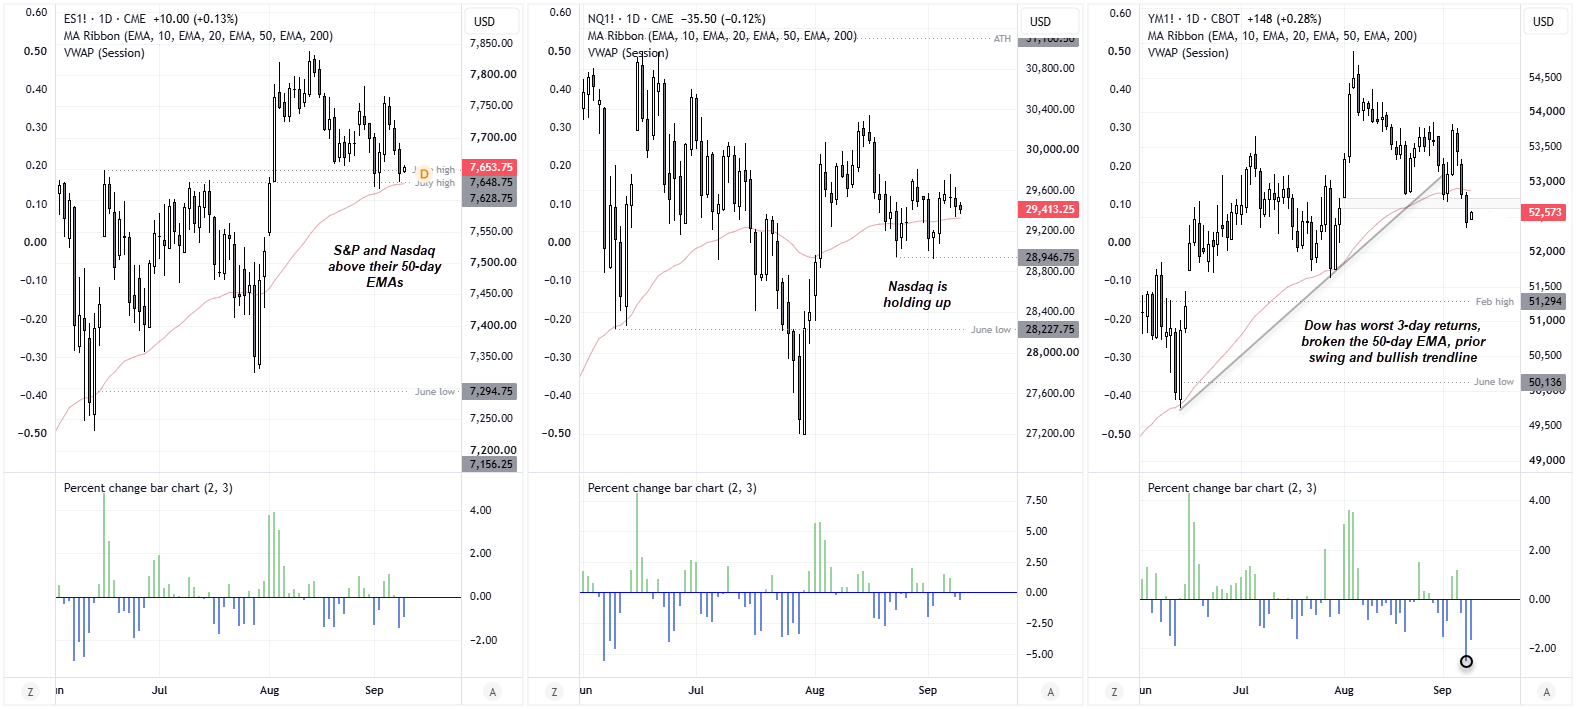
The Dow Jones has led Wall Street lower this week so far, with futures falling as much as 2.8% from last week’s high compared with 1.8% for the S&P 500. Concerns over inflation and interest rates are taking their toll on economically sensitive stocks. Yet the Nasdaq has fared relatively well by comparison and is trying to hold above its 20-day EMA. For now, at least.
However, while the Nasdaq is holding up, breadth across all three Wall Street titans appears to be falling apart at the seams.
Source: CME, CBOT, TradingView
Nasdaq Resilience Masks Weakening Market Breadth
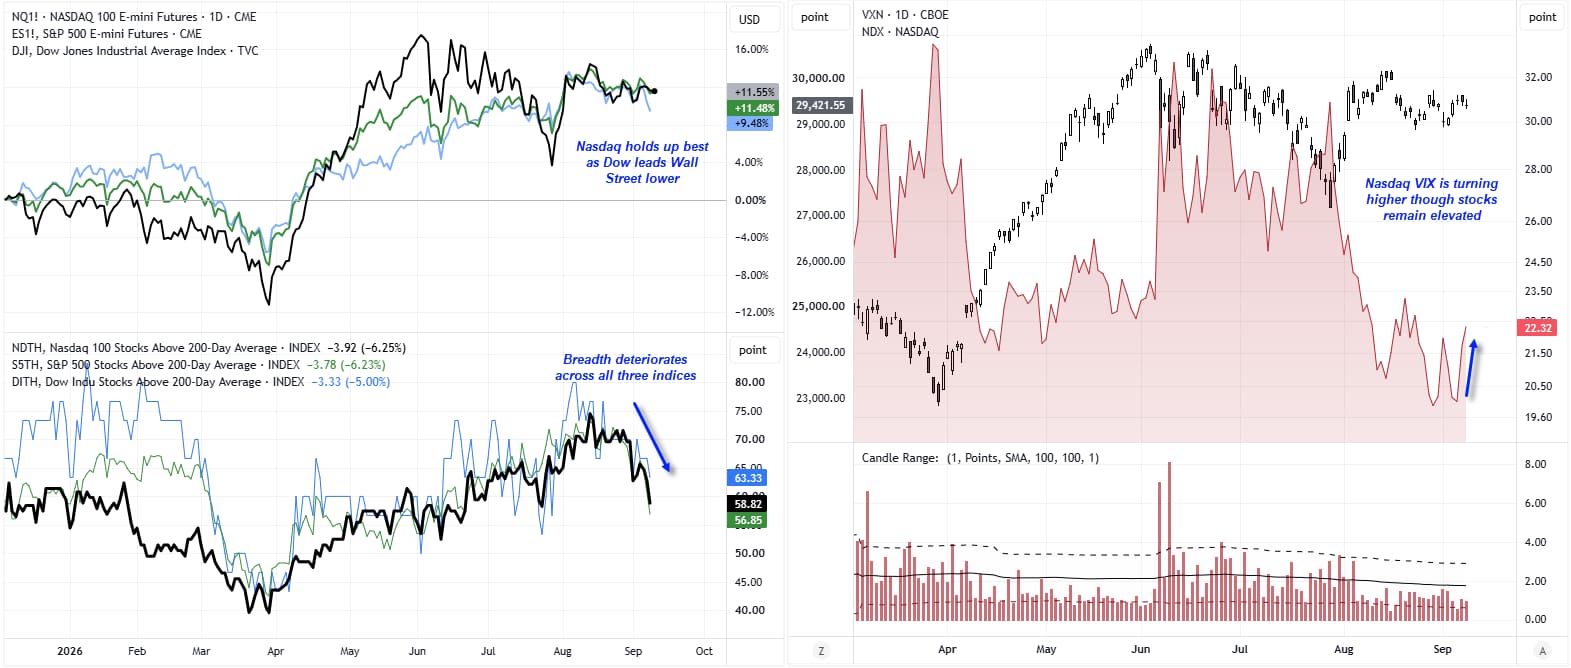
While the Nasdaq continues to hold up better than the Dow and S&P 500, the underlying picture is weakening. Breadth has deteriorated sharply across all three indices, with fewer stocks now trading above their 200-day averages even as the Nasdaq remains relatively elevated.
The Nasdaq VIX is also turning higher, which, combined with weakening participation, suggests the index is becoming more fragile beneath the surface. For now, large-cap tech is still doing enough to keep the Nasdaq supported, but a break lower could see broader selling pressure accelerate.
This could make the Nasdaq the one to watch to confirm a wider selloff. If it continues to hold while breadth stabilises, the divergence may simply reflect rotation. But if the Nasdaq begins to break lower as breadth continues to weaken, it would remove the market’s strongest pillar and could leave the broader indices vulnerable to a deeper pullback.
For now, bears may be better served seeking shorts on the Dow Jones and seeing whether it can break its next set of support levels. If a suitable risk-on catalyst resurfaces, attention could then shift back to the Nasdaq.
Source: CME, LSEG

Dow Jones Futures (YM) Technical Analysis
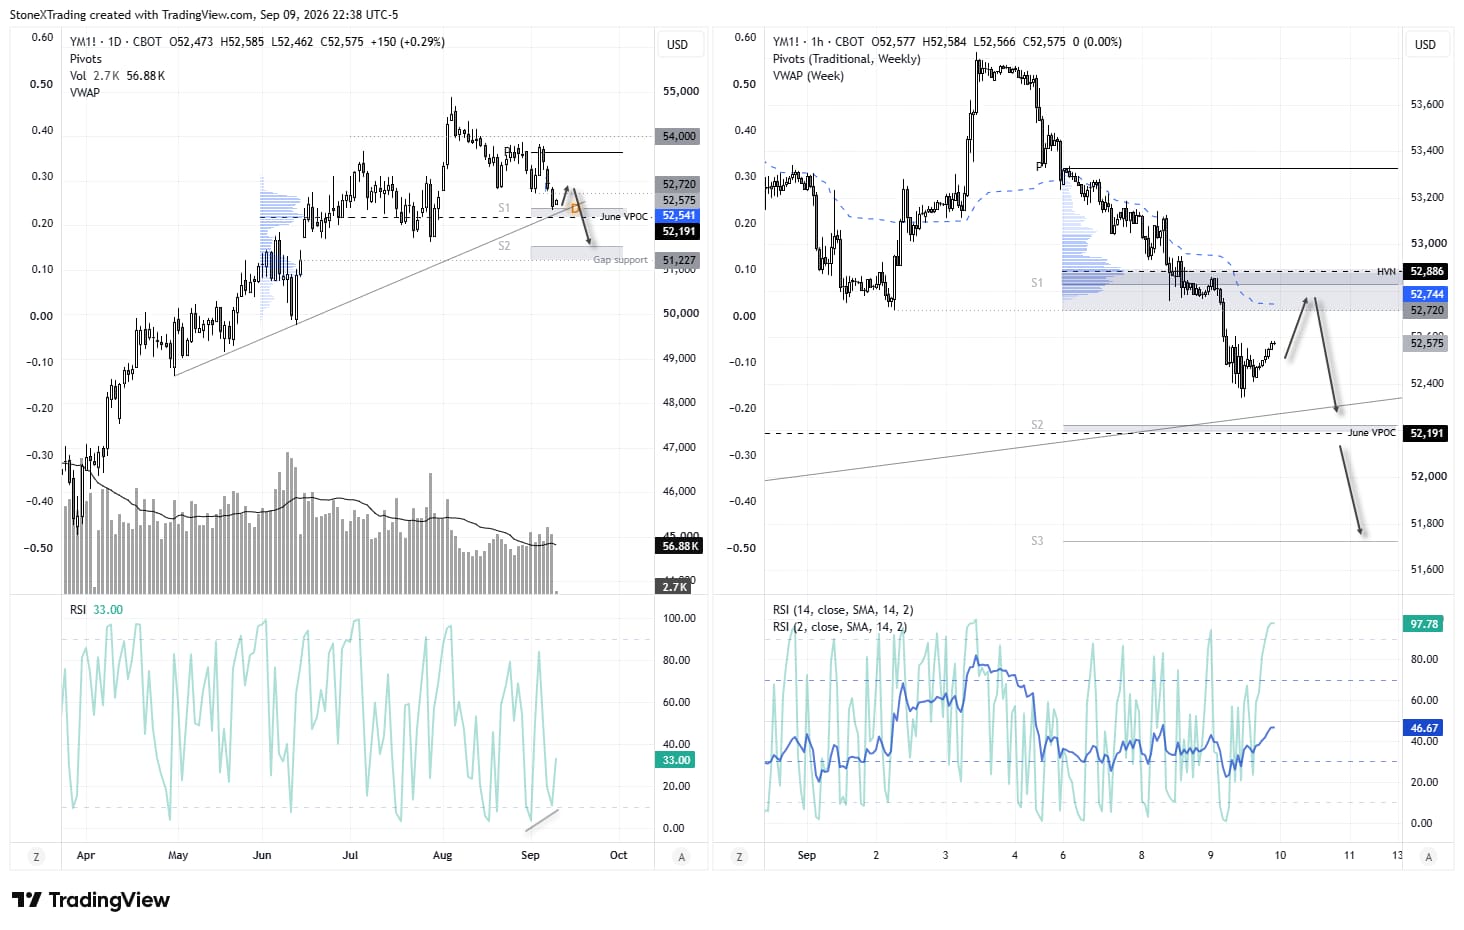
While momentum currently points lower on the Dow Jones daily chart, support is nearby. Yesterday’s lw respected the weekly S1 pivot point (52,408) and the June VPOC (52,191) is nearby. Though note that the 3-day sell-off was accompanied by above-average volume, so bears have intent. Yet failure for prices to break lower could force them to cover and help the Dow bounce over the near term.
The 1-hour charts shows a steady downtrend, through prices are now retracing higher towards the weekly VWAP (52,744). But with ther 52,720 low, monthly S1 pivot and HVN around 52,000, bulls may have a near target and bears an area to reconsider fading into.
Source: CBOT, TradingView
Dow Bears Eye 51k
Whether a small bounce extends into a large one, or bears step back in, could hinge upon sentiment from the Middle East and this week’s US PPI and CPI report. For now, my bias is for a bounce and then break of support and bears to have a crack at closing gap support just above 51,000. Should risk-on return, the Nasdaq is my preferred Wall Street index for bullish bets.