
- EUR/AUD and GBP/AUD compress within bearish descending triangles
- Relative rates continue to favour the Aussie against Europe
- Industrial metals show strong inverse relationships with both crosses
- Flash PMIs loom as short-term volatility risk, not bias changer
EUR/AUD and GBP/AUD both find themselves compressing within descending triangles, which of course are a bearish continuation pattern that suggests the broader downtrend from the highs set last year may be about to resume.
Adding to the case for downside, the macro forces that look to be underpinning it are also working in the Aussie’s favour, with recent correlation analysis suggesting it’s been less about movements in the energy complex and more about relative rates, risk appetite and strength across the industrial metals complex doing much of the heavy lifting.
Aussie tailwinds line up with bearish technicals
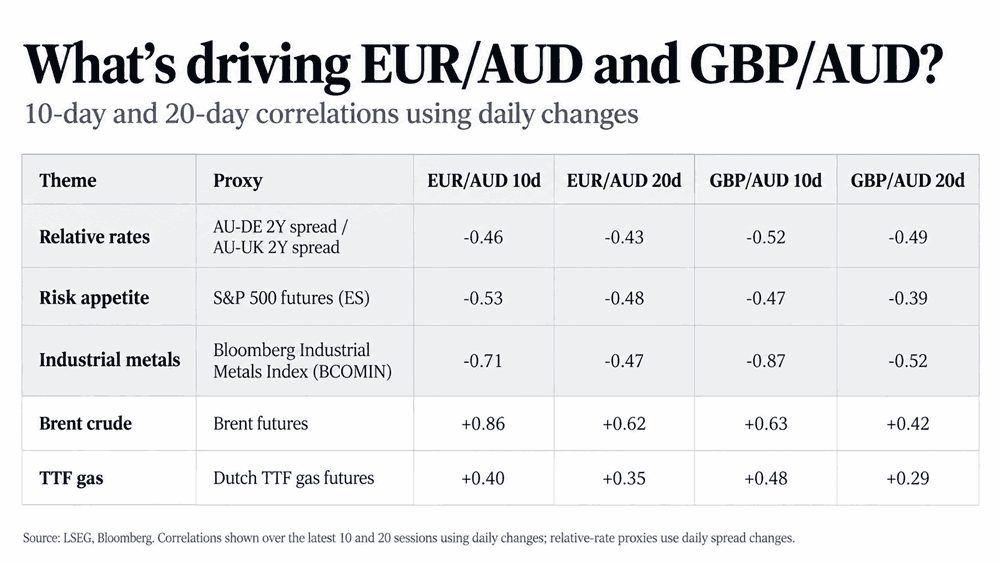
While it’s not a definitive assessment that’s been rigorously tested, the graphic below gives a general sense of how those macro factors may be fuelling Aussie strength, with movements in broader energy markets not demonstrating the kind of relationship you might fundamentally expect given the vastly different energy-security picture across the three currencies.
Source: LSEG
Using Germany as the proxy for the broader Eurozone, you can see that relative rates have had a mildly inverse relationship with both pairs over 10- and 20-day windows. The same can also be said for S&P 500 futures, which we’re using here as a proxy for broader risk appetite.
Interestingly, Australia’s standing as not just an energy superpower but a broader commodity powerhouse may also be providing tailwinds, with strength across industrial metals showing some of the strongest inverse relationships with both pairs, particularly over the 10-day window.
Taken together, should that combination continue, it points to continued Aussie dollar strength relative to the European crosses, adding to the case for renewed downside in EUR/AUD and GBP/AUD.
EUR/AUD downside pressure continues to build
Source: TradingView
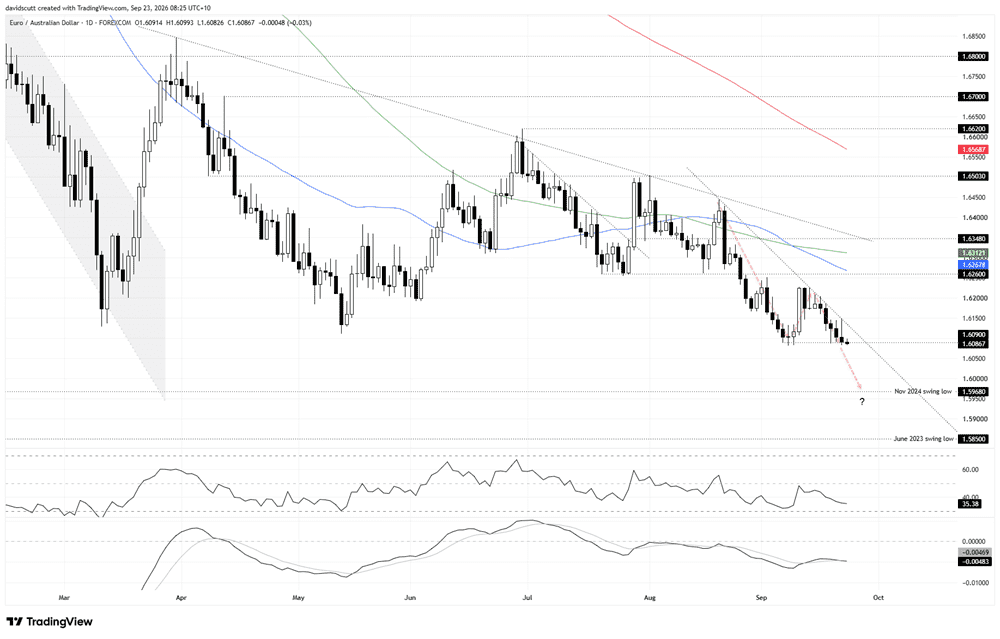
EUR/AUD finds itself compressed against downside support as part of a broader descending triangle structure dating back to the middle of August. After being comprehensively rejected at the upper side of the structure on Tuesday, the price is now testing 1.6090, where the pair has continually attracted bids in recent times.
However, with the price now below its key medium and long-term moving averages, all of which carry a negative slope, and with the oscillators pointing to renewed downside pressure, the price action just looks and feels heavy.
If we were to see a clean break beneath support at 1.6090, downside targets of note include the November 2024 swing low at 1.5968 and, beyond that, the June 2023 swing low at 1.5850. A clean break would allow for short positions to be established beneath the level with a tight stop above for protection, targeting those levels.
While it’s the least favoured of the two setups right now, a breakout through the upper side of the triangle would point to the potential for a bounce towards the confluence of the 50-day moving average and former support at 1.6260, which flipped to offering resistance earlier this month.
GBP/AUD tests support within descending triangle
Source: TradingView
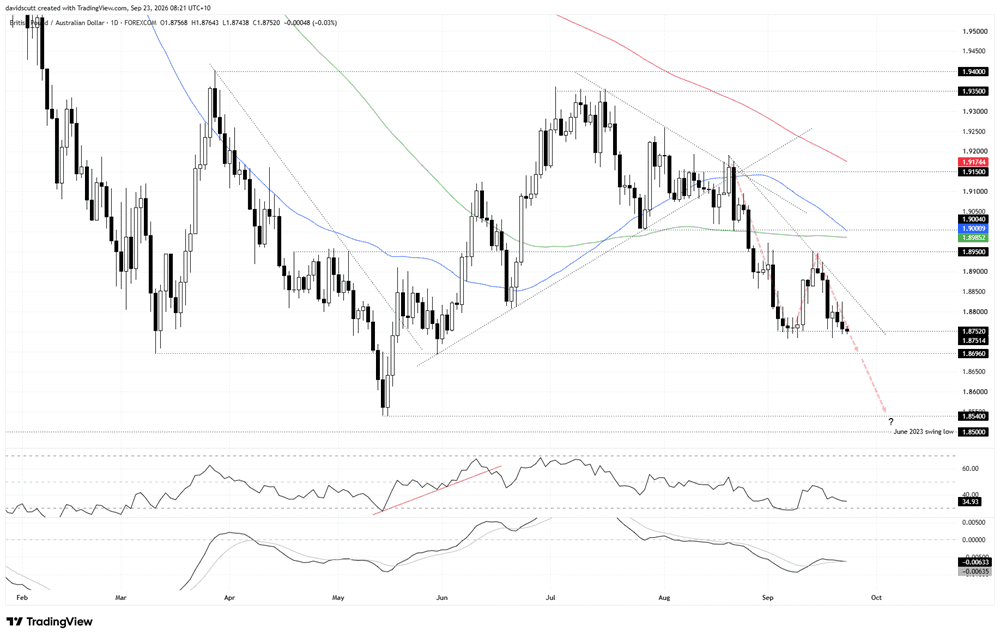
It’s an almost identical technical picture for GBP/AUD, which now finds itself testing the lower end of its descending triangle structure at 1.8752. With the oscillators pointing to building downside momentum and the price sitting beneath its key medium and long-term moving averages, bearish setups are favoured over bullish at this stage.
However, unlike EUR/AUD, GBP/AUD faces the added complication of nearby support at 1.8696, which acted as a swing low back in March and also delivered a sizable bounce in late May. With multiple downside wicks having already failed beneath the lower end of the structure, you get the sense that it may be a tough slog initially if we were to see a downside break.
However, if 1.8696 were to be broken cleanly, there’s not a lot of technical support evident until the swing low set in May at 1.8540, with 1.8500, the June 2023 swing low, another target after that.
On the topside, offers were parked above 1.8825 earlier this week, making that the first reference point before the upper side of the structure kicks in just beneath 1.8850 today. They are the two immediate focal points overhead, with 1.8950 another more established level that has acted as both resistance and support for lengthy periods this year.
PMIs loom as short-term volatility risk
Even though the calendar is fairly quiet over the remainder of the week, and the evidence suggests economic data hasn’t really been doing much of the heavy lifting for either pair recently, we do have global flash PMI data out today. When you’re talking about Europe, those releases have had a decent track record in the past of generating moves across European FX names, so they should still be on the radar for anyone trading EUR/AUD or GBP/AUD.
That said, given what’s been driving both pairs recently, it doesn’t really loom as the kind of catalyst that on its own would be likely to generate a lasting shift in bias.