


Over the past four trading sessions, gold has shown a variation of approximately 2.5%, reflecting a lack of clear direction following recent central bank decisions. These moves have given a temporary boost to bond yields, limiting gold’s ability to fully regain its previous bullish bias. As long as bond recovery remains steady in the short term, indecision in gold’s price movements is likely to continue dominating in the coming sessions.

Is a Substitute Asset Emerging for Gold?
During the past week, several central banks announced new interest rate decisions, with the U.S. Federal Reserve standing out. Although the Fed cut its rate by 0.25%, bringing it to a new target range of 4.00%, officials later indicated that the bank could adopt a more neutral stance toward year-end. This signals a more restrictive outlook, as it suggests the Fed may avoid additional cuts at its final meeting scheduled for December 10.
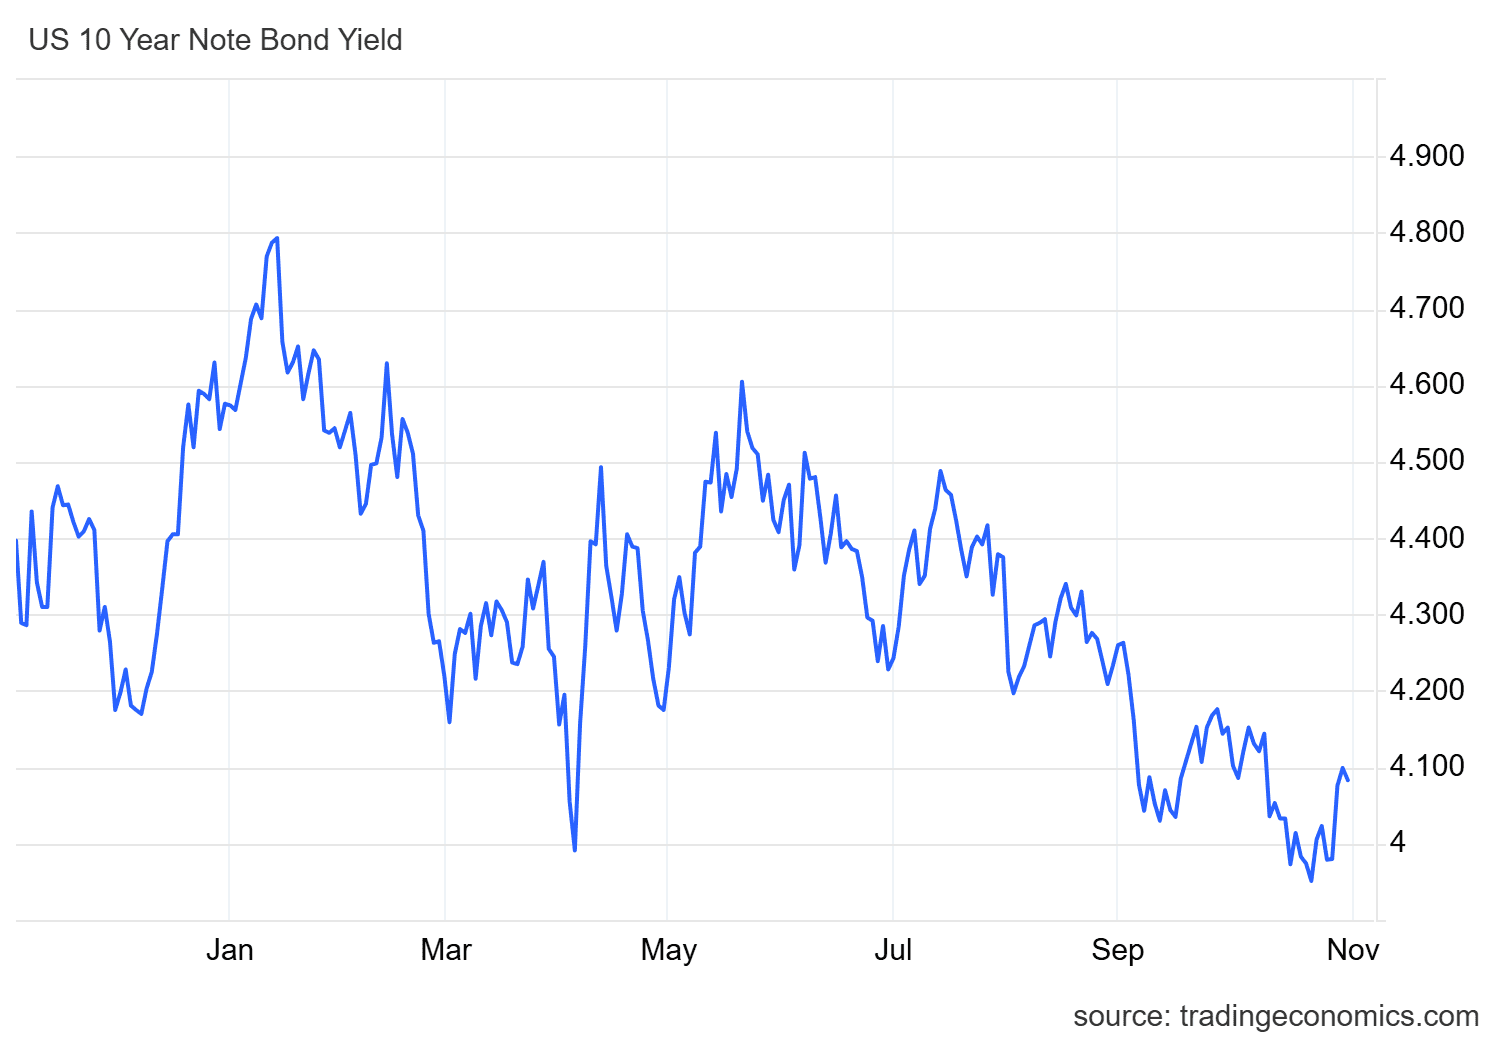
The announcement caught financial markets by surprise and triggered a rebound in 10-year U.S. Treasury yields, which remain one of the most relevant substitute assets for gold due to their steady interest payments. In fact, following the Fed’s meeting, yields climbed back to the 4% level, unseen since early October, reinforcing the appeal of Treasuries as an alternative safe haven.
Source: TradingEconomics
It is worth noting that one of the main bullish drivers for gold in 2025 occurred when markets anticipated a series of Fed rate cuts, which weakened bond yields at the time. However, the current scenario is different: the expectation of a more neutral monetary policy has led to a steady recovery in bond yields, increasing their relative appeal compared to gold — an asset that, unlike bonds, does not generate interest.
If U.S. bond yields continue to rise in the coming sessions, the relative attractiveness of gold could further decline, creating greater market indecision and possibly leading to stronger selling pressure in the short term.
What’s Happening with the U.S. Dollar?
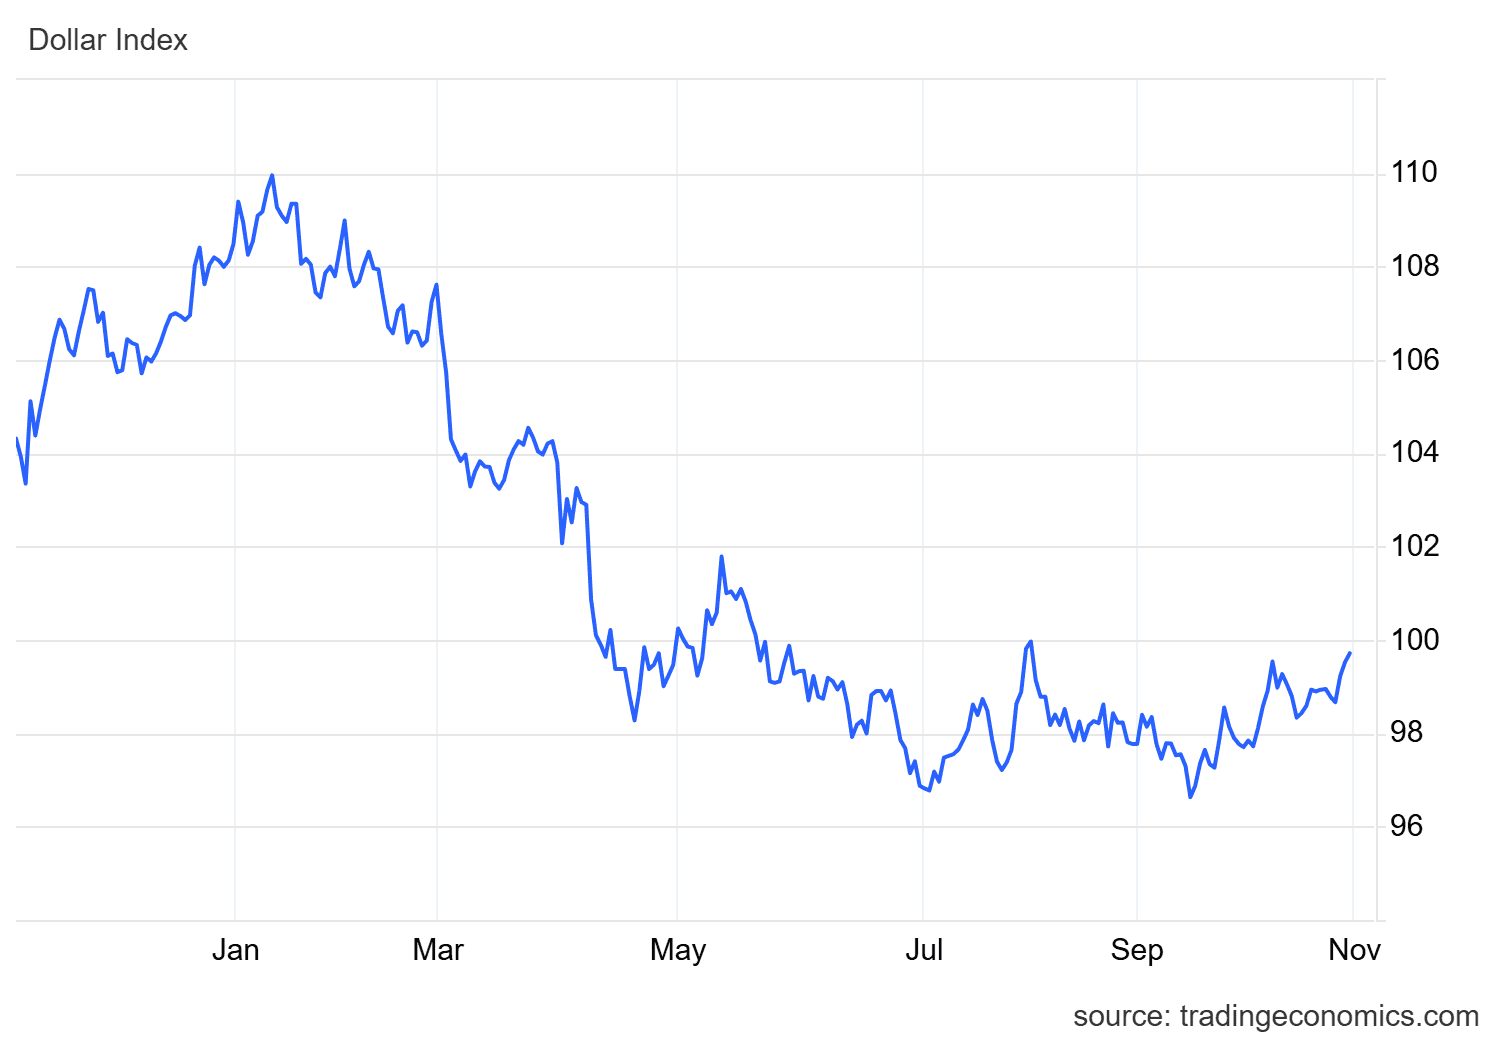
Alongside the rebound in bond yields, higher demand for Treasuries has also boosted demand for the U.S. dollar. The DXY index, which measures the dollar’s strength against other currencies, has shown a notable recovery in recent sessions, approaching the 100-point level and reflecting renewed investor confidence in the dollar.
Source: TradingEconomics
It is important to consider that gold is priced in U.S. dollars in international markets; therefore, a stronger dollar makes the metal more expensive for buyers using other currencies. As a result, if the DXY index continues to recover steadily, global demand for gold could weaken — particularly among investors who do not operate in U.S. dollars. In this scenario, the gold market could maintain a more pronounced bearish bias in the short term.
Likewise, a stronger dollar tends to reduce gold’s appeal as a safe-haven asset, especially in an environment where expectations of a firm dollar and rising Treasury yields draw investors’ attention toward interest-bearing assets, diminishing demand for the precious metal.
Gold Technical Outlook
Source: StoneX, Tradingview
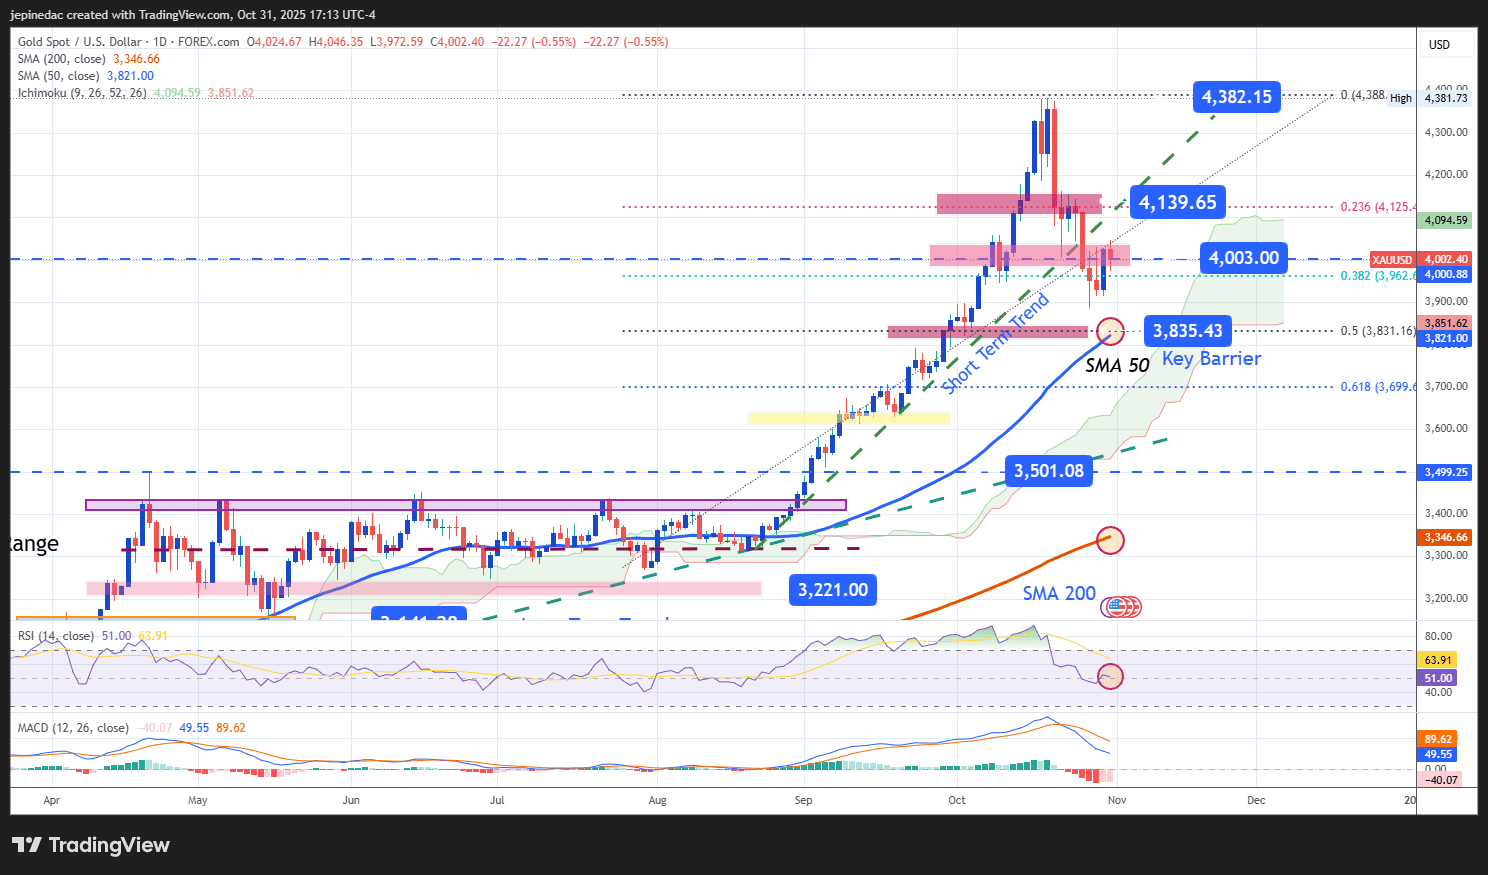
- Short-Term Trend at Risk: Since late August, gold had managed to maintain a steady uptrend, reaching new highs near $4,400 per ounce. However, recent downward movements have begun to break the trendline, projecting a more neutral outlook in the short term. This has become increasingly evident in recent sessions, as gold has struggled to sustain its bullish momentum. If the price continues without clear directional movement, this neutrality could give way to stronger selling pressure or potentially form a sideways trading channel.
- RSI: The RSI line shows a steady downward slope, currently hovering near the 50 level, suggesting a balance between buying and selling forces. As long as the indicator remains around this zone, neutral momentum is likely to dominate gold’s movements in the coming sessions.
- MACD: The MACD continues to oscillate below the zero line, indicating a prevailing bearish bias in short-term moving averages. If the histogram continues to display slight downward movements, it could signal a more consistent selling pressure in the medium term.
Key Levels to Watch:
- $4,139 – Major Resistance: This level coincides with the 23.6% Fibonacci retracement, acting as a key barrier for bullish momentum. A sustained move above this area could reactivate the short-term uptrend and strengthen the bullish bias.
- $4,000 – Near-Term Barrier: A psychological level, representing a zone of neutrality observed in recent weeks. Continued price fluctuations around this level could lead to the formation of a short-term sideways range.
- $3,840 – Critical Support: Considered the most important support level, this zone aligns with the 50-period moving average. A decisive break below it could signal a structural bearish shift, paving the way for a stronger downtrend and a dominant bearish bias in the sessions ahead.
Written by Julian Pineda, CFA – Market Analyst
Follow him on: @julianpineda25






