

Gold Talking Points:
- Inflation remains elevated in the U.S. but that doesn’t seem to be a hindrance to a Federal Reserve that’s widely expected to cut rates at their next meeting in two weeks.
- While the Fed’s dual mandate may suggest that rates should actually be higher, pressure from President Trump combined with a fracture within the bank may bring a move in an apparent pre-emptive effort to head off possible softening.
- Perhaps the bigger question will be market response, as we saw long-term yields shoot higher after the Fed began cutting rates last year. That also led to a flare in inflation as CPI crossed back-above 3%, which was followed by the Fed sounding unsure around future rate cuts earlier this year.
- Gold has been in an aggressive bullish trend for a year and a half now, going back to an interesting comment from Austan Goolsbee last February when the Chicago Fed President seemingly dismissed above-target inflation and instead hinted towards oncoming rate hikes. Gold has rallied by more than 75% since then.

Gold spent three and a half years resisting the $2k/oz level, but that’s only part of the story. Perhaps more interesting is what finally allowed for bulls to prod a break above that and run a rally to a fresh all-time high; and that’s a story that’s still being written today.
But to tell that story properly, really, we need to go back to the summer of 2020, when the global economy was still largely shut down and the Federal Reserve had just implemented life support measures for global markets. Jerome Powell had an appearance on 60 Minutes, the television program, in May of that year. He had a comment along the lines of “there’s not much that we cannot do with the liquidity programs available to us.” And that line really defines the backdrop, where even though many businesses were prohibited from opening or operating, markets had become untethered from reality as they clawed back losses from the March sell-off. Bonds were rallying and so were stocks, and by August, the S&P 500 had hit a new fresh all-time-high.
Gold was also in a massive trend and it was early August of 2020 that spot gold traded at the $2k level for the first time ever. This was somewhat of a storied level as the rally back in 2011 fell just short, with spot gold setting a high at $1920 before pulling back and, eventually, reversing. But in 2020, sellers couldn’t stand in the way, and gold was finally able to push above the big figure and it stayed above for about a week. And that’s where matters really began to shift.
Gold Daily Chart (Jan – Oct 2020)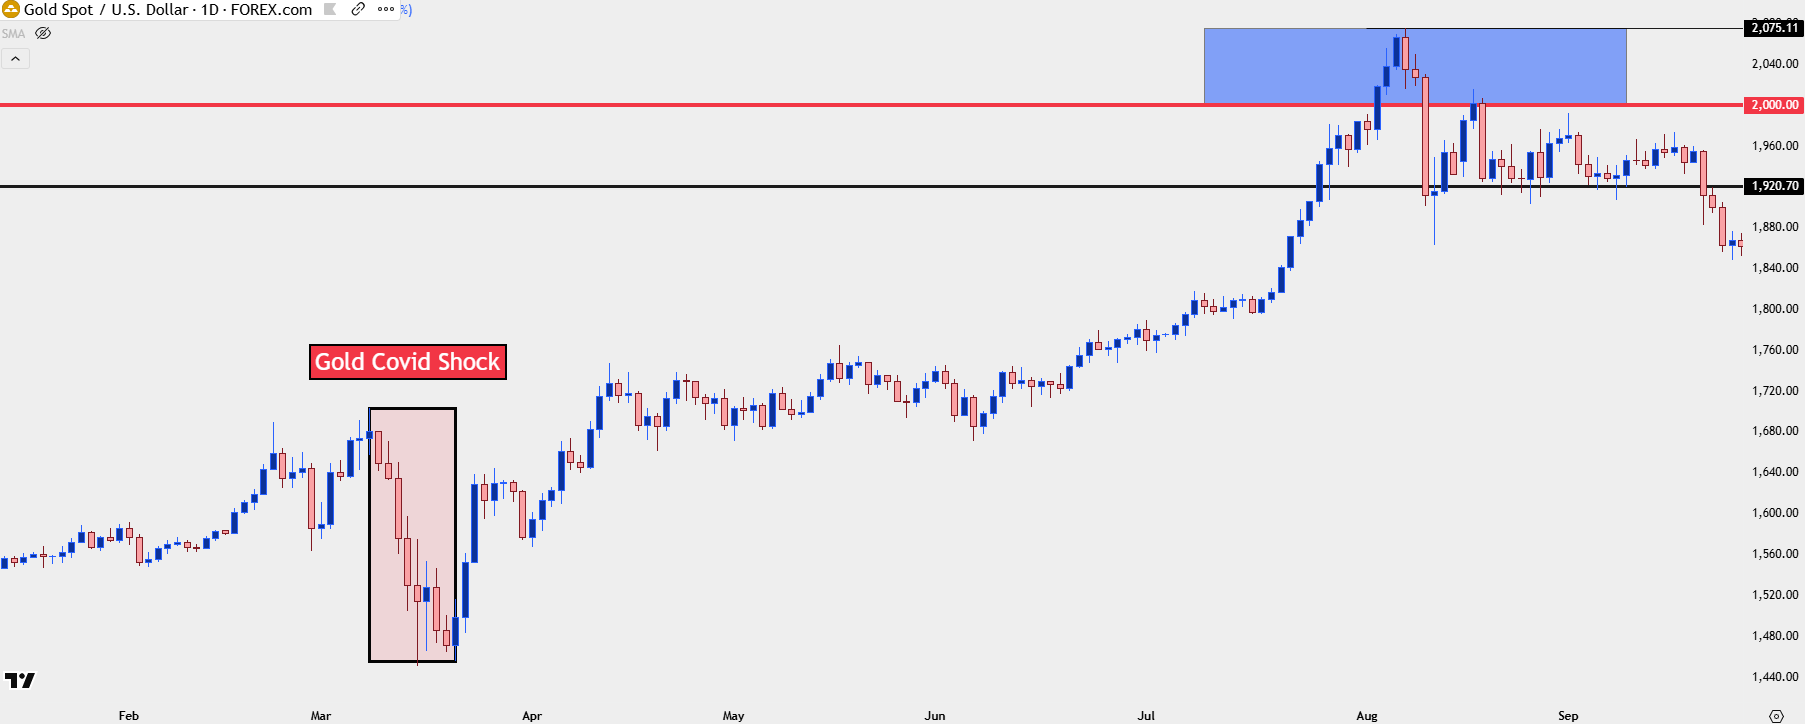
Chart prepared by James Stanley; data derived from Tradingview
Gold and Bitcoin
To give some additional context to the backdrop, Bitcoin was struggling to get back above the $12k level at the time, and it’s prior ATH was just inside of $20k at $19,666 (so another major psychological level making a mark). And at that point it was almost as if gold traders started to look around the next corner, as the Fed was already pedal to the floor with accommodation and, logically, this would eventually lead to the build of inflation in a way that the world hadn’t seen in 40 years.
And in gold, that psychological level proved to be too daunting, as each subsequent trip above eliciting selling which led into a pullback and a sell-off. And for three and a half years, that remained the case.
During that time Bitcoin went into an entirely new mode as bulls pushed to a 2021 high just inside of $65k, and after a pullback to $30k with a couple months of support, they went for another push up to $70k which fell just short in November of 2021.
That was the point where the Fed had started to finally waive the white flag, saying that inflation had proven too persistent to ignore. And while there were no formal apologies and only slight admittance that they were wrong to have called inflation ‘transitory’ and ‘supply chain-driven,’ the Fed started to shift into a more-hawkish posture in 2022, and that’s when Bitcoin prices really started to fall quickly.
In gold that seemed to be less concerning, however, as the metal had already established a clean range, and buyers had been showing support around the $1700 level for much of the year. And as a war bid built with Russia lining the Ukrainian border with tanks, gold again tried and failed to break above the $2k/oz level.
And as the Fed pushed into a rate hike cycle, gold prices pulled back into the range with another strong push-lower in June as the FOMC ramped up to 75 bp hikes in effort of stemming inflation.
Gold Weekly Chart (Jan 2020 – Dec 2023)
Chart prepared by James Stanley; data derived from Tradingview
Gold Readying for a Break
It was March of 2023 when the consequence of rate hikes started to show in the banking sector. With the meltdown at Silicon Valley Bank and then the worry around several regional banks in the United States, it soon became concerning that we may be on the cusp of another contagion event, where one bank going bust would lead to others doing the same.
This is when the Fed started to soften their tone on policy and while they couldn’t go full-fledged dovish as inflation still remained far too high, they did start to whittle back to the expectation fore more hikes, and gold responded with a fresh ATH and another test above $2k, although buyers were again thwarted as the big figure brought on selling at a major spot on the chart.
It’s what happened after that, however, that began to set the stage for the rally that remains alive today. The pullback in mid-2023 held support just above $1800/oz, and this is around the time that the Fed started to gently open the door to the possibility of rate cuts in the following year. At the December FOMC meeting, the Fed started to sound fairly certain that their next move would be a cut rather than a hike, and gold responded by finding support at the same $2k level that had previously been used as resistance for much of the prior three years, and this ushered in the bullish backdrop that led to last year’s breakout as that $2k level suddenly became a contentious spot of support.
Gold Daily Chart (Dec 2023 – May 2024)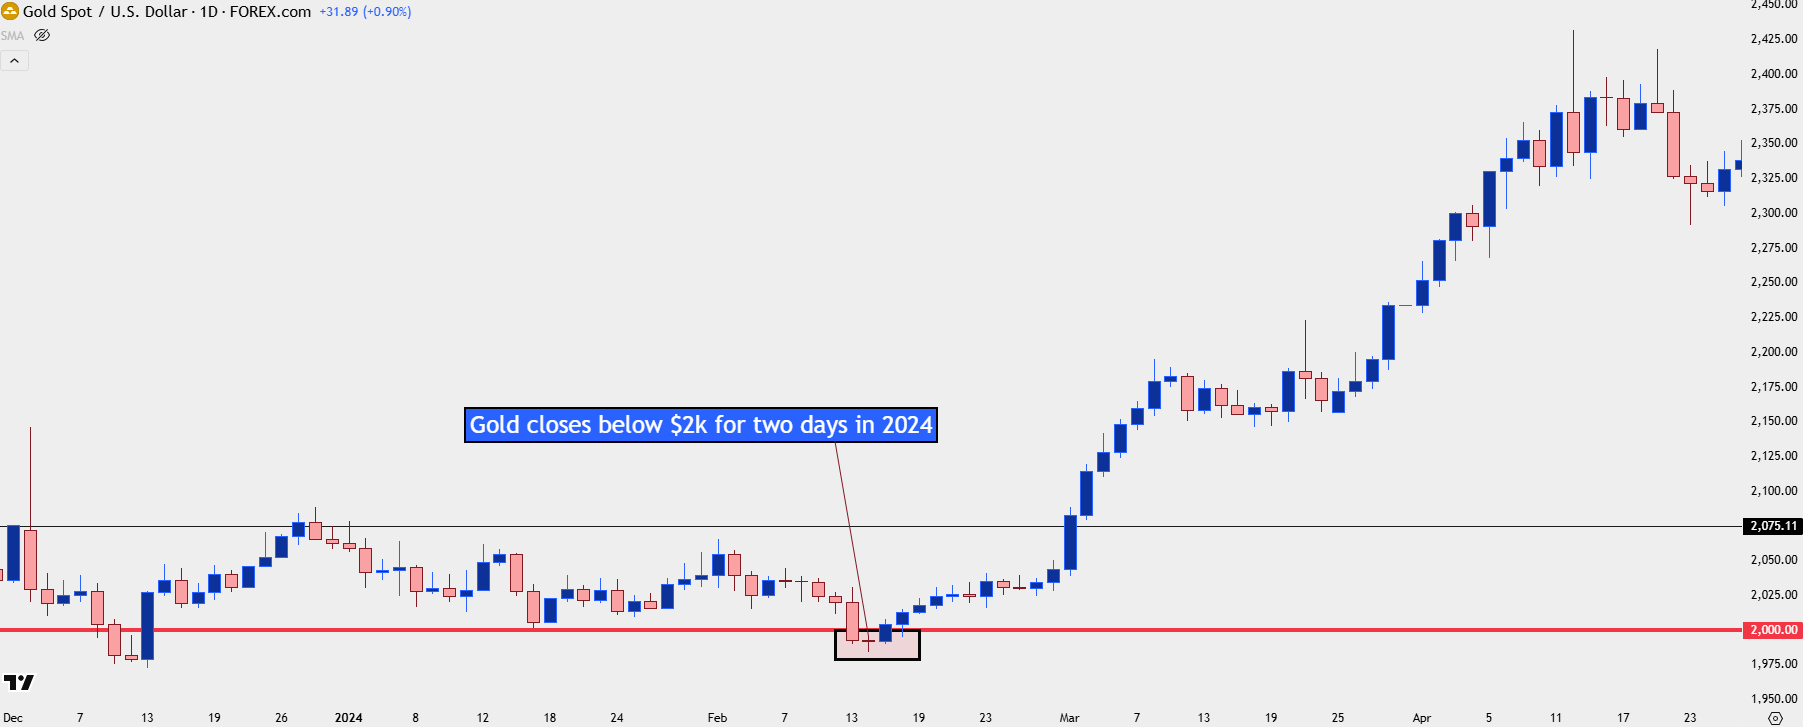
Chart prepared by James Stanley; data derived from Tradingview
Gold Launches
In 2024 there were just two days in which spot gold closed below the $2k level, and they were around a CPI report released in February that made it look as if the Fed’s job wasn’t yet done on inflation. That wasn’t the first CPI print that made it look like cutting would be a problem later in the year, as Core CPI had held close to 4% and headline CPI was still above 3%.
On February 13th, both core and headline CPI printed above their expectation and suddenly the market started to expect that there may not be any rate cuts after all. USD-strength showed up and stocks pulled back; gold fell below $2k for the first time since December and it was starting to look like range continuation was back on the cards.
But just a day later, Chicago Fed President Austan Goolsbee had a comment in a media interview, imploring market participants not to get ‘flipped out’ around a single inflation print, and this was widely read that the Fed was going to look past the data. And pulling on that string, it showed a Fed that really wanted to cut rates, even if inflation wouldn’t currently allow for such.
The next day gold rallied above $2k/oz, and it hasn’t looked back since. An aggressive move drove for much of last summer, and that continued all the way until price paused just below the $2800 level, about a week before the election. And that’s when another shift into Bitcoin saw gold prices pause as BTC prices jumped with some help from the Presidential election.
That pause-point lasted for about two months, with gold building in a bull pennant formation that held into the 2025 open.
Gold Daily Chart (Dec 2023 – Feb 2025)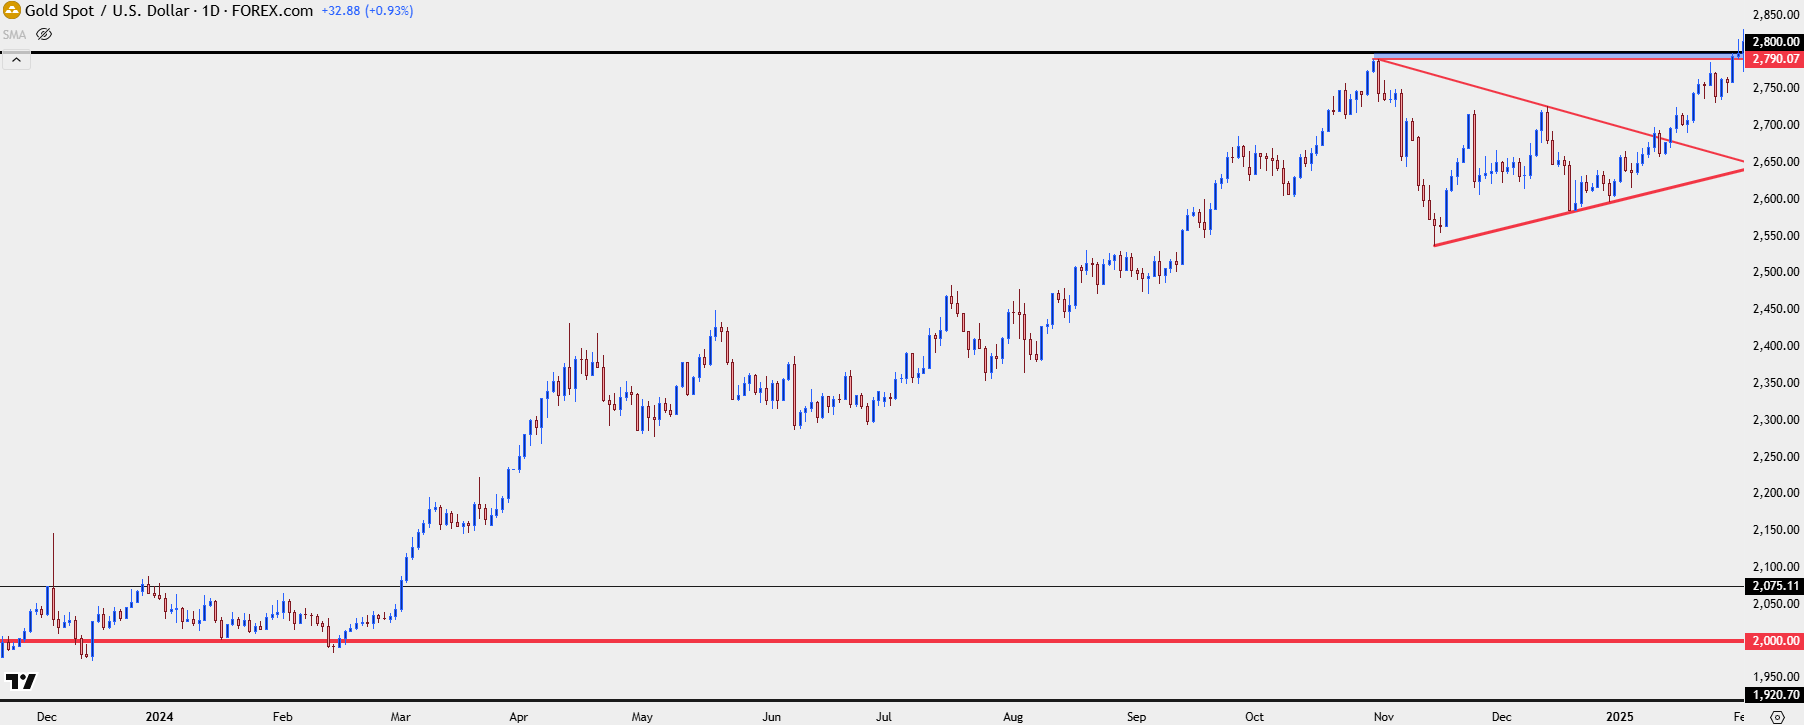
Chart prepared by James Stanley; data derived from Tradingview
The first three-and-a-half months of 2025 saw a similar drive in gold as prices continually set fresh all-time-highs. This was capped by the test of another major psychological level at $3500 around the Easter holiday. That was a point where, similar to $2k, gold bulls took profit and led to a pullback.
But, like what showed in Q4 of last year, those pullbacks were increasingly shallow as they held a trendline of higher-lows. This created yet another bull pennant formation that I had highlighted in an article just a couple of weeks ago. And shorter-term, there was another bullish formation as taken from a falling wedge which is similarly approached with aim of bullish breakouts.
Gold Daily Chart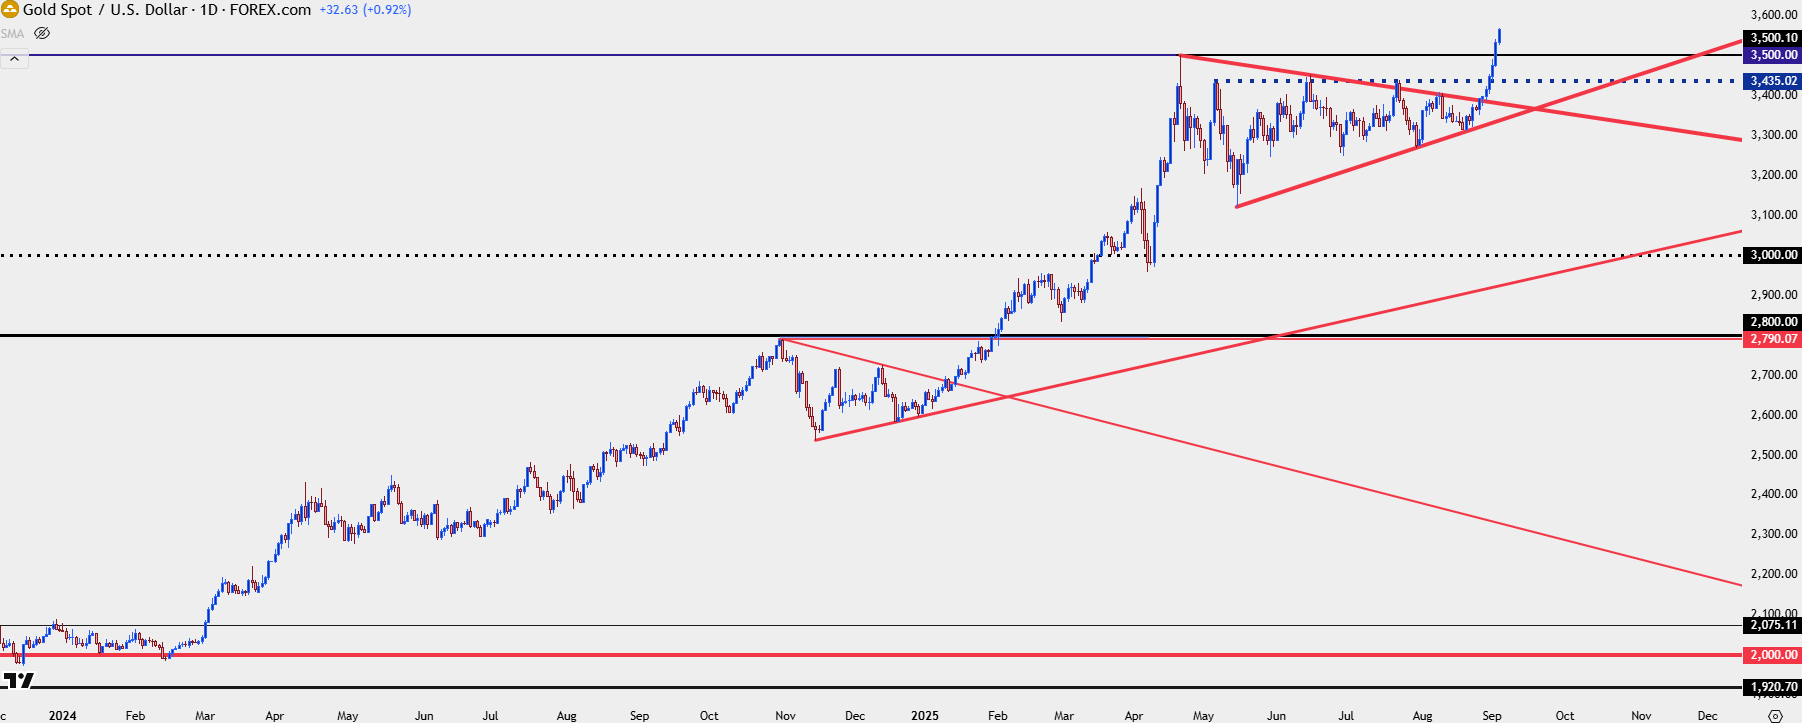
Chart prepared by James Stanley; data derived from Tradingview
Why?
A natural question here is why is gold doing something that it hasn’t really ever done before, at least to the scale or degree that we’re seeing? And I think a good answer to that is that markets are pricing in an attitude change at the world’s largest Central Bank.
Monetary policy is not a panacea, nor is it a cure-all. But seeing the Fed stay dovish, cutting rates, even with inflation well-above their 2% target, it illustrates that something else is going on. Perhaps the Fed is trying to get in-front of a possible recession or maybe it’s the Fed trying to appease President Trump.
Perhaps more importantly, any rate cuts at the Fed don’t necessarily mean that longer-term rates must drop, such as we saw last year. The Fed cutting short-term rates by 50 bps in September helped to launch Treasury yields higher in October and that helped to drive the move in gold, at least initially until gold began to build in the first bull pennant formation.
If investors have the opportunity cost of earning yield on their capital, Treasuries can be a more attractive venue, particularly after a stretched and prolonged rally in gold. But, if those same investors fear taking principal losses in those bonds as inflation expectations drive yields higher (and prices lower), well, gold suddenly looks a lot more attractive.
So what could eventually create reversion in the gold move is some element of prudence from either the Fed or Congress, and from where we’re at currently, that’s a difficult scenario to imagine as a possibility. So for those holding long-term debt, the Fed’s expectations at the rate decision in two weeks are perhaps far more important than the 25 bps of softening that’s already been priced-in.
--- written by James Stanley, Senior Strategist






