
There’s a bit of resolution in gold this week as the late-January sell-off led into three weeks of consolidation, which has taken on the form of an ascending triangle formation that was broken-through in early trade this week. Now the 5100 level that was resistance-turned-support before becoming resistance in that formation is back in play for a support test.
Like the last two weeks, there was an active bounce at the time of the webinar. Two weeks ago, it was a bounce at 5k that led up to a 5100 re-test and then last week, it was the 4856 zone that was in-play with a pensive test before bulls were ultimately able to re-take control.
Gold Four-Hour Chart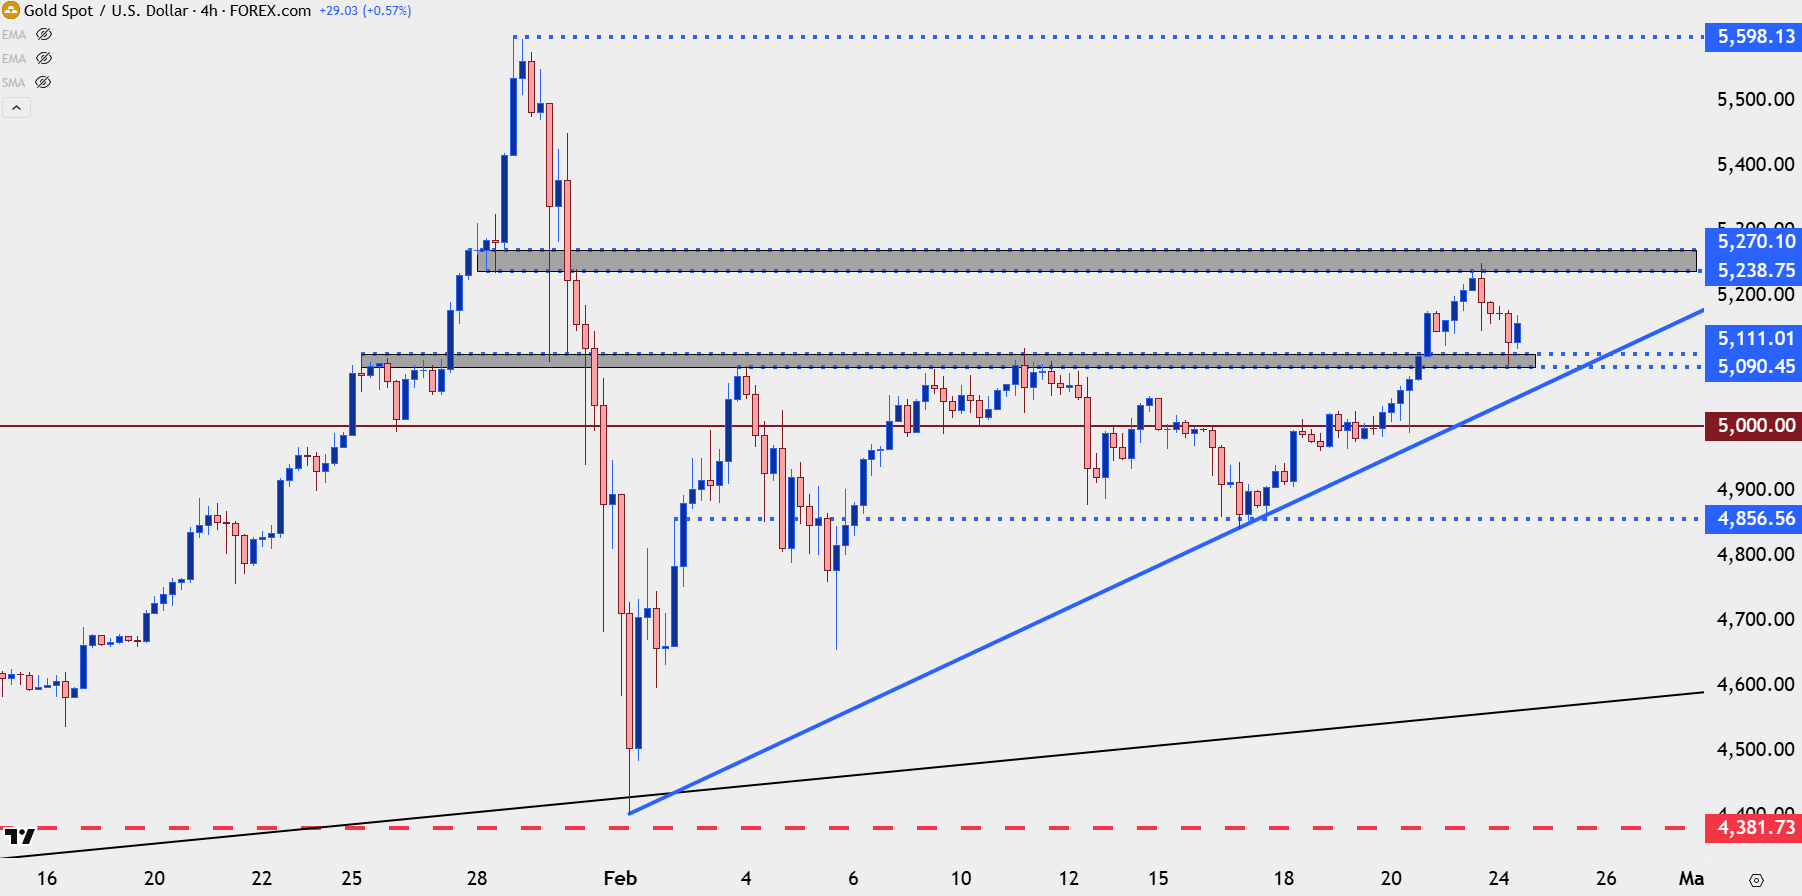
Chart prepared by James Stanley; data derived from Tradingview
USD
While gold has an ascending triangle that’s already led to breakout, and was followed by a pullback and support test at prior resistance, the US Dollar remains in an ascending triangle formation. I looked at this in the weekend video and since then there was a pullback to and hold of support in the 97.33-97.46 zone.
Bulls still have a shot here but whether this takes hold or not I think still drills back to USD/JPY and whether that pair can continue to run-higher.
US Dollar Four-Hour Chart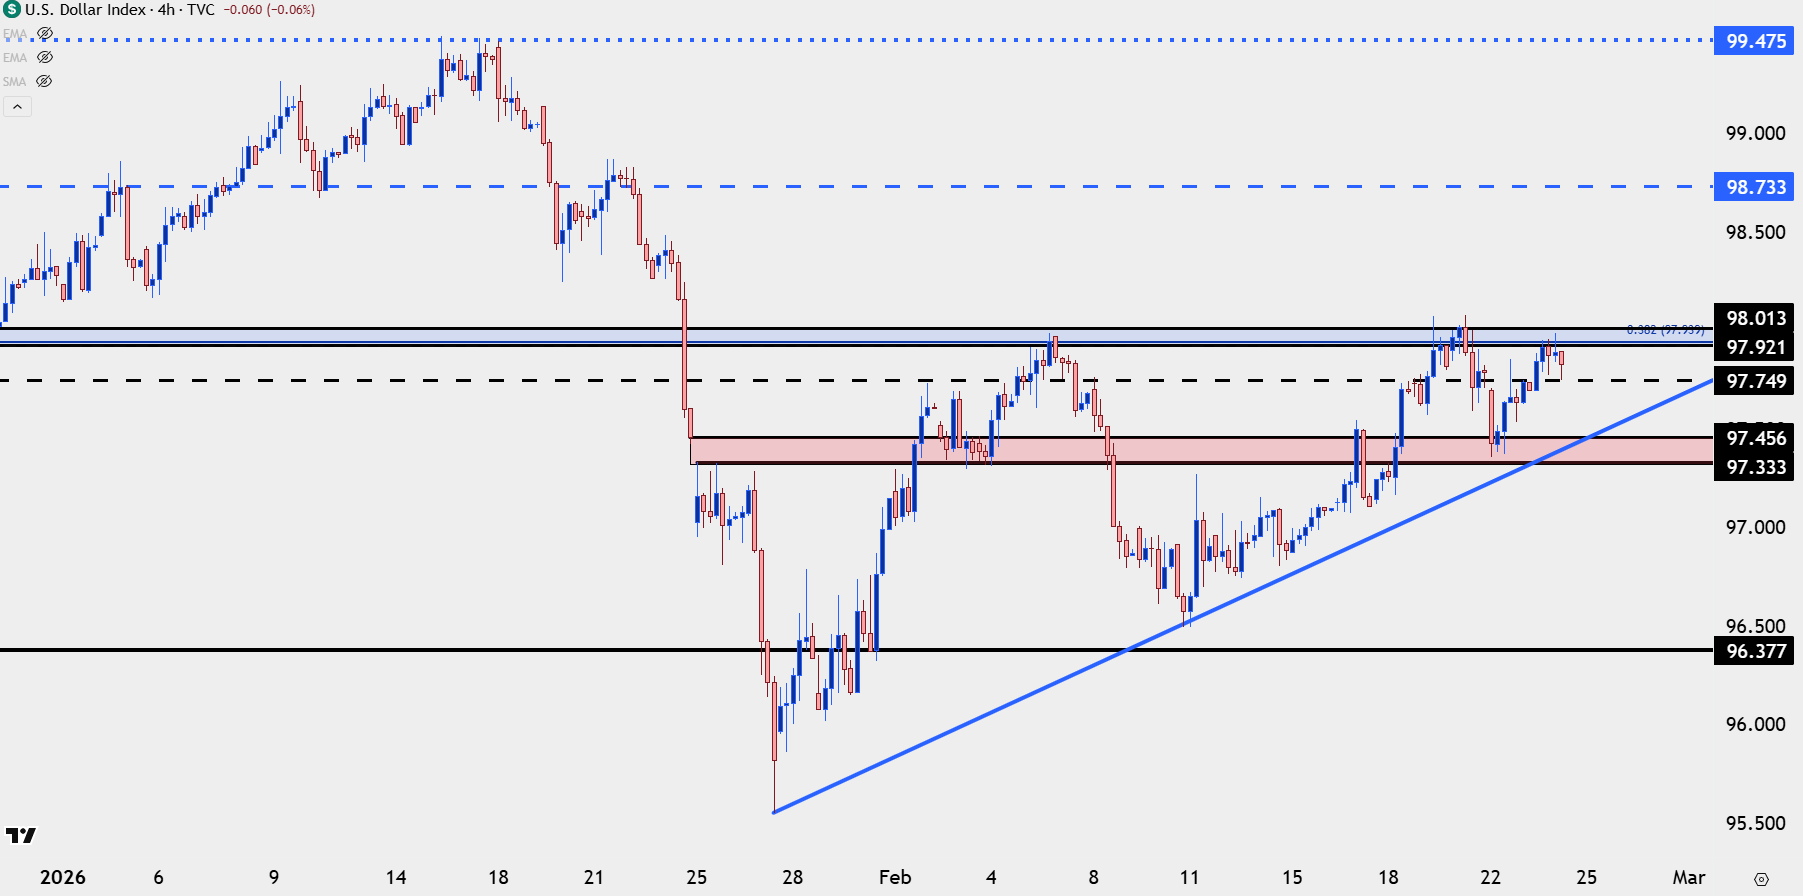
Chart prepared by James Stanley; data derived from Tradingview

USD/JPY
USD/JPY remains constructive and this is a good example of where price leads narrative. The big headline item overnight was the Takaichi administration’s take on BoJ rate hikes, but realistically this is a move that started a week ago. I looked at this in the webinar last week and this week we have greater development with price pushing into next resistance at 156.27. There’s now support potential at the 155 zone with 154.84 and 154.45 coming into the picture just below that.
USD/JPY Four-Hour Chart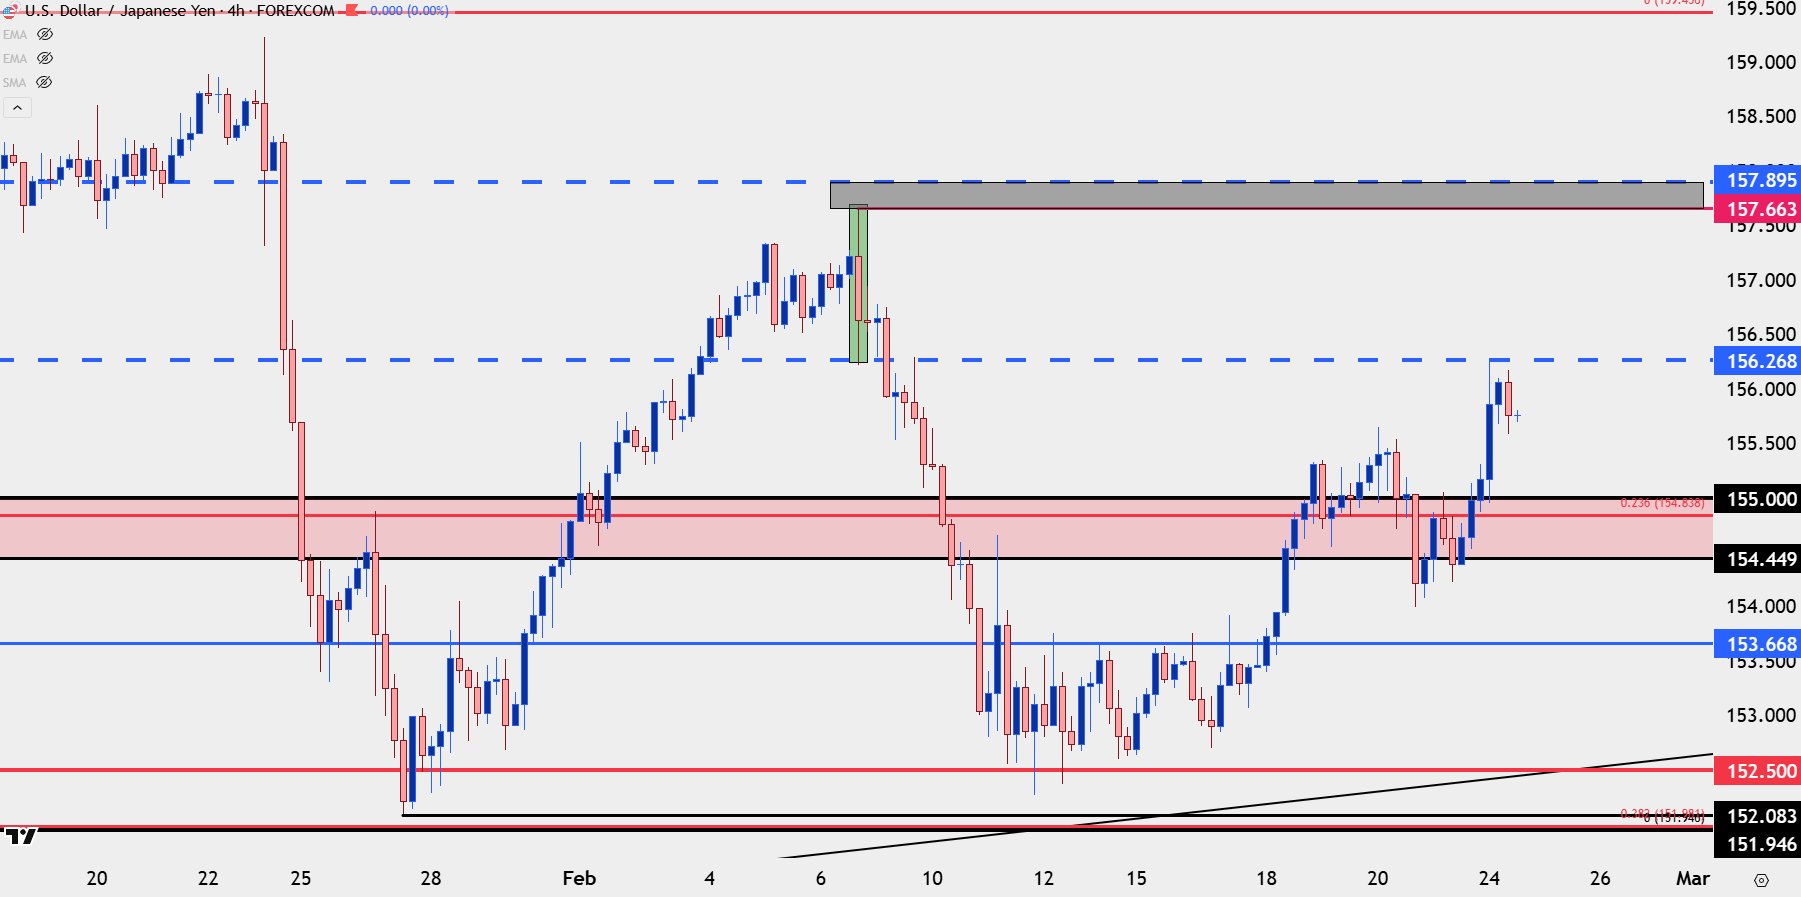
Chart prepared by James Stanley; data derived from Tradingview

EUR/USD
For USD-weakness I think EUR/USD is attractive. The pair has just re-engaged with the 1.1748 Fibonacci level which has been notable for eight months now, and this is related to the Fibonacci sequence I looked at in the evergreen article on the topic a year ago.
That support coming into play has helped to build a falling wedge and those are bullish reversal formations, so if we do see USD fail to break through resistance (which I think would need to root from USD/JPY), then EUR/USD upside scenarios are attractive.
EUR/USD Daily Price Chart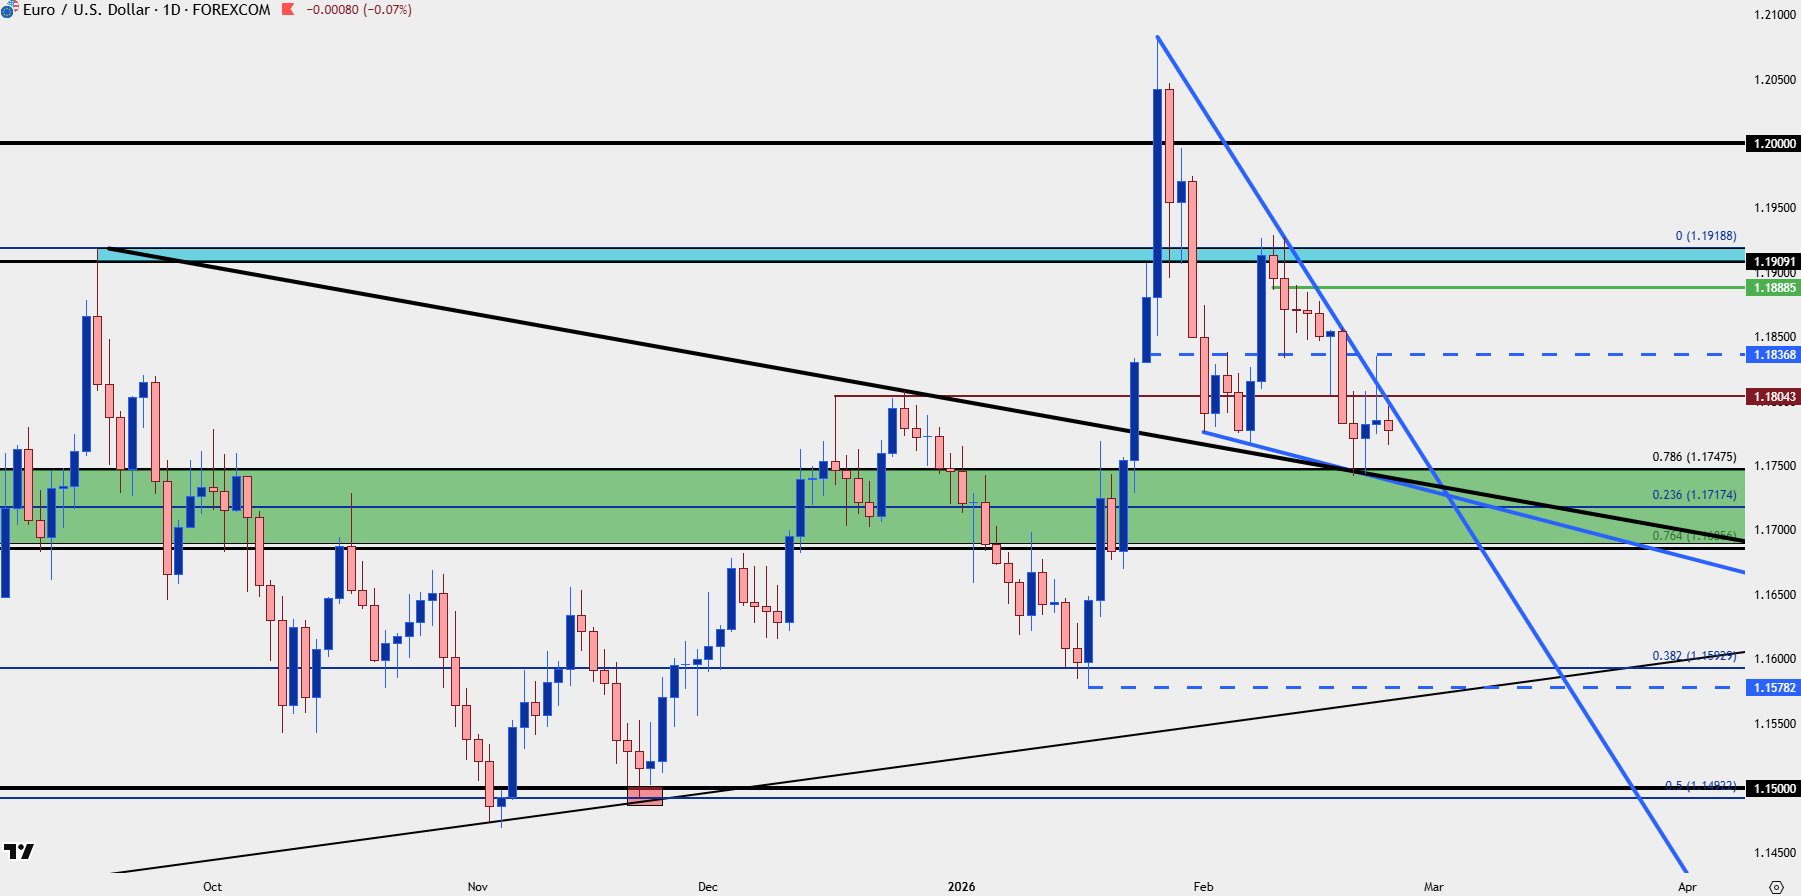
Chart prepared by James Stanley; data derived from Tradingview
GBP/USD
There’s a similar backdrop in Cable and the falling wedge in the pair from earlier in the year shows ideal resolution of such formations. Of course, that’s a sample size of one so it’s important not to read too much into any singular instance, but this highlights what the attractive resolution for this formation would be here in GBP/USD as well as EUR/USD above.
GBP/USD Four-Hour Price Chart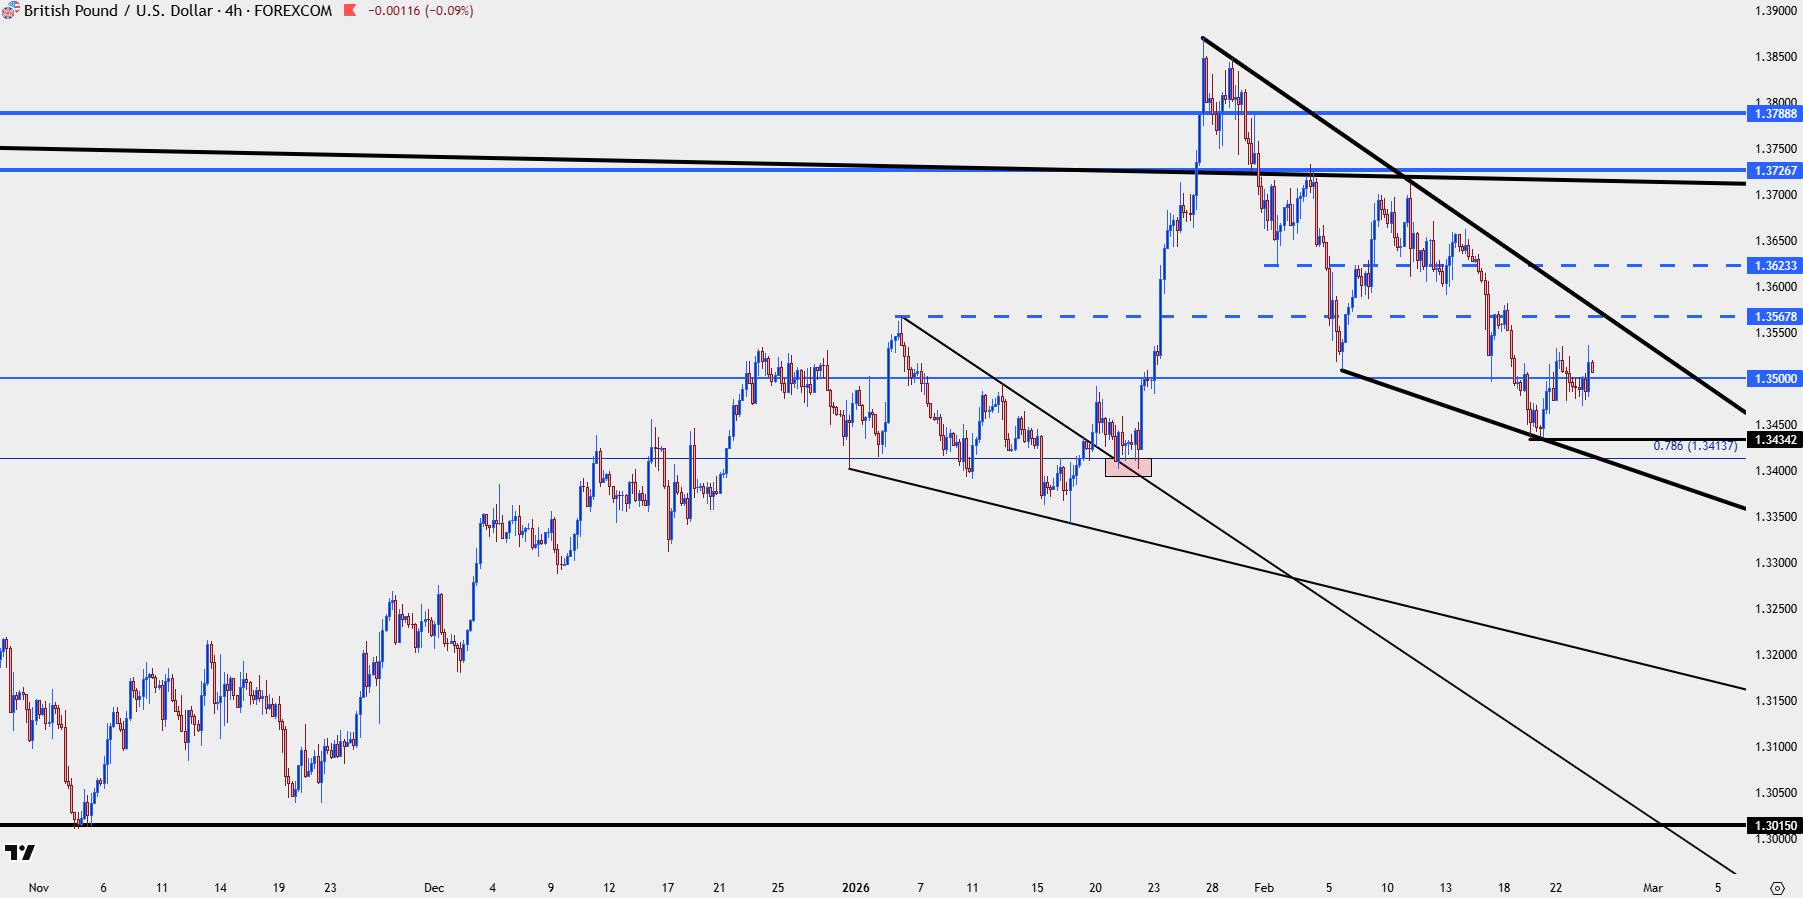
Chart prepared by James Stanley; data derived from Tradingview
--- written by James Stanley, Senior Market Analyst, Global Macro