
- Nasdaq 100 tests major support after another sharp selloff
- Treasury yields fall, reversing the pattern of previous declines
- Bond buying persists despite hotter-than-expected US inflation
- Price action around support may determine the next move
Nasdaq 100 selloff raises familiar questions
The Nasdaq 100 has fallen more than 5% from the record high set earlier this month, driven by renewed concerns surrounding the AI trade, including questions over CoreWeave's outlook.
But we've seen this movie before. There were substantial drawdowns in March, June and July this year, only for bulls to return in force and push the index to fresh record highs. The question now is whether the latest decline is yet another temporary scare ahead of major technology earnings over the coming fortnight, or the beginning of something far more substantial and potentially sinister.
Everyone knows about the enormous sums being committed to AI infrastructure and the question of whether those investments will generate sufficient returns to justify current valuations. Bulls will tell you absolutely, while bears point to unproven business models and parallels with the speculative excesses preceding the early-2000s tech wreck.
I don't know the answer. But one thing I do know is that, relative to the selloffs earlier this year, it's not just technology stocks behaving differently. The US Treasury market is sending a very different message from the one we saw during those previous declines.
US Treasurys send a very different message
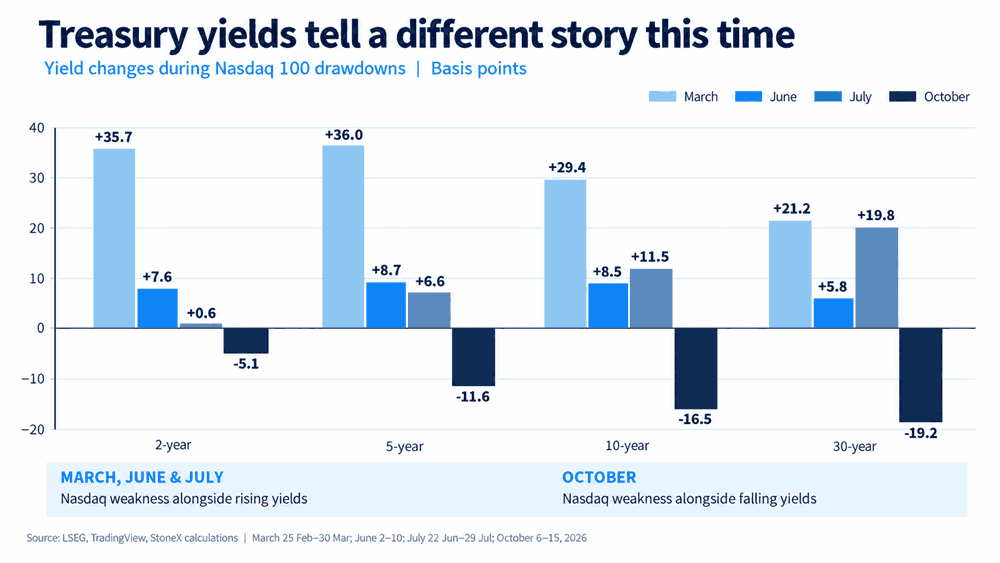
As the graphic below reveals, during the Nasdaq 100 declines in March, June and July this year, Treasury yields actually increased as the selloffs unfolded.
Source: TradingView. LSEG
Of course, there have been plenty of macro forces to digest this year, particularly the impact of rising energy prices stemming from the conflict in the Gulf. And we can't ignore the importance of relative yield levels when comparing the different episodes. But this time, we're seeing the complete opposite.
Since the Nasdaq 100 peaked on October 6, the two-year Treasury yield has fallen five basis points, the five-year yield 12 basis points, the 10-year yield 17 basis points and the 30-year yield an impressive 19 basis points.
It's been one almighty bull flattening of the curve, a move that can sometimes be associated with growing concerns about the outlook for economic growth.
What makes the bid in bonds even more noteworthy is that it has come despite a far hotter-than-expected US inflation report for September on Wednesday, which would ordinarily be expected to put upward pressure on Treasury yields. And still bonds were bid, with buying continuing as risk assets have come under further selling pressure.
It feels like Treasurys are reverting to their traditional role as a safe haven. The question is why investors are seeking that safety.
I get the sense that markets, rightly or wrongly, are looking at the wobbles in the AI trade and starting to extrapolate what they might mean for the broader US stock market, the outlook for further Fed rate hikes and the prospects for continued US economic exceptionalism.
At this stage, that feels like a very long bow. But if those concerns eventually move beyond market narrative and start showing up in hard economic data, it would strengthen the argument that we may have already seen the highs in Treasury yields.
Nasdaq 100 tests major support zone
Source: TradingView
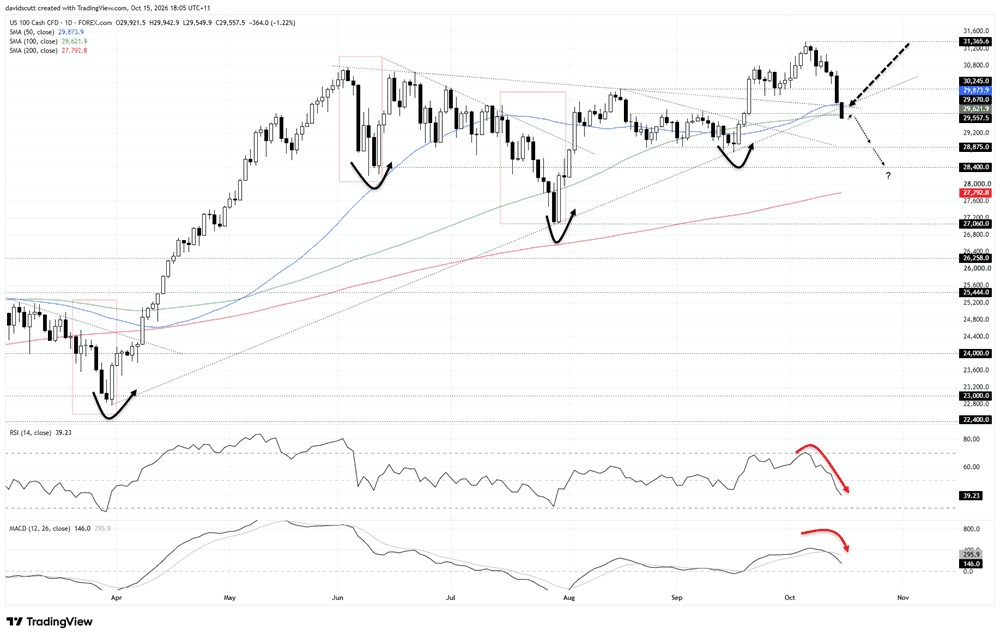
Turning to the Nasdaq 100 daily chart, the latest decline has seen the price break beneath uptrend support running from the late-March lows and the very shallow downtrend that had acted as resistance before the breakout in mid-September.
Along with horizontal support at 29,670 and the 100-day simple moving average, we've now got four technical levels converging within a relatively narrow price range, creating a broader support zone.
The price is currently trading marginally beneath the lower end of that zone, although I'd want to see the break stick into US trade before putting too much weight on it. As the chart shows, we've seen several sharp reversals following previous declines this year, so how the price responds around this zone could be very informative as to where directional risks lie over the medium term.
Looking at the oscillators, we've seen a sharp reversal in momentum, with RSI (14) falling from overbought territory to beneath the neutral 50 level. MACD has also staged a bearish crossover, although it remains in positive territory for the time being.
That favours short setups over longs from a momentum perspective, although I'm putting more weight on price action given the confluence of support currently being tested.
If the price holds beneath the support zone into the US session, particularly if followed by a backtest and rejection of former support, it could provide an opportunity to establish shorts with a tight stop above the lower boundary of that zone for protection against reversal.
The initial downside target would be 28,875, a level the price bounced from on several occasions during August and September. Beyond that, 28,400 comes into view, a less precise level that has acted as both support and resistance on several occasions. Further downside would bring the 200-day moving average, currently around 27,793, into focus, followed by the late-July swing low at 27,060.
Alternatively, if the price recovers the March uptrend, potentially delivering something akin to a bullish reversal candle in the process, it could provide an opportunity to establish longs.
The initial upside target would be 30,245, a level that has acted as both resistance and support during the year. Beyond that, the record high of 31,365, set only a couple of weeks ago, would come back into view.