


- New Zealand CPI up 1% q/q, 3% y/y
- Inflation at top of RBNZ band
- Housing, utilities drove gains
- RBNZ Rate cut in Nov remains fully priced
NZD Outlook Summary
Inflation in New Zealand has reaccelerated, climbing to 3% annually and hitting the upper limit of the RBNZ’s target band. However, underlying measures continue to soften, leaving room for further rate cuts. Markets are betting on another 25bp move in November, but with NZD/USD showing tentative signs of bottoming, traders face two-way risks in the days ahead.
Inflation Returns to Top of RBNZ Range
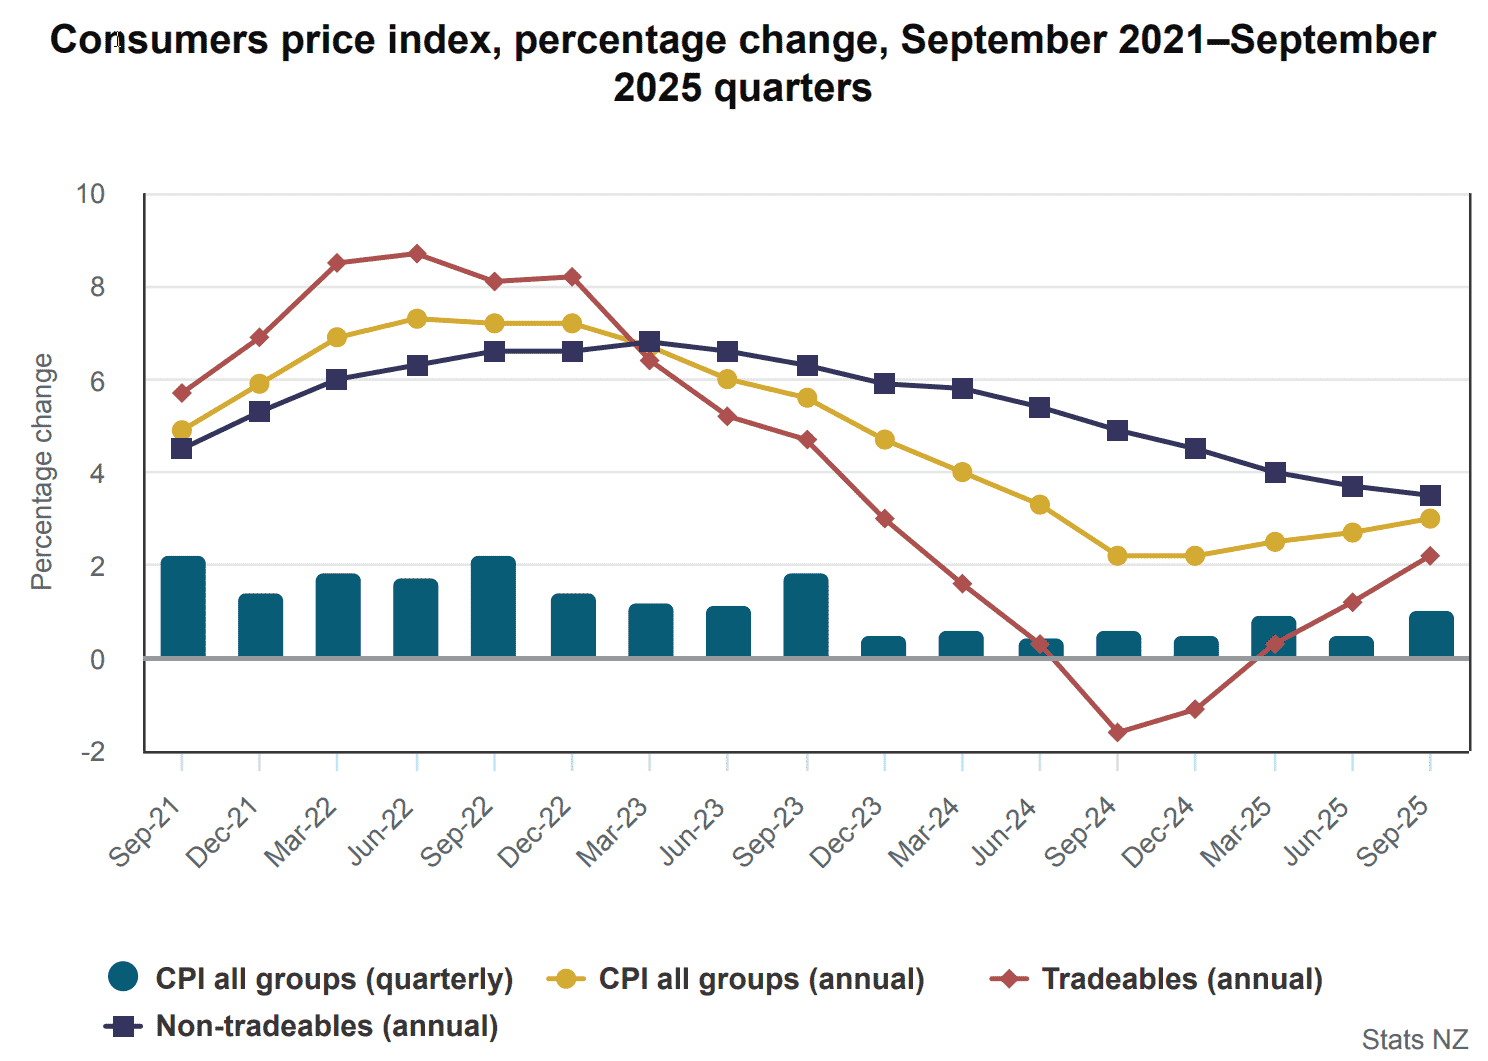
Headline inflation rose 1% for the quarter and 3% over the year, the latter in line with both market expectations and forecasts issued by the RBNZ two months ago. The annual rate was the highest level in more than a year, reaccelerating after troughing at 2.2% in Q3 2024. It now sits at the upper end of the RBNZ’s 1–3% inflation target band, although detail within the report continued to provide room for the bank to keep reducing interest rates should underlying economic conditions remain weak.
Annual inflation was again led by housing and household utilities. Electricity prices jumped 11.3%, the biggest rise since the late 1980s. Local authority rates rose 8.8%, remaining a key driver of inflation despite easing from last year’s surge. In contrast, rents lifted 2.6%, the smallest annual increase in over four years.
The three components, which make up about 17% of the CPI basket, accounted for nearly a third of the annual rise in consumer prices.
Source: StatsNZ
Non-tradeable items, which generally reflect domestic economic and policy decisions, increased 1.1% for the quarter, seeing the annual rate moderate to 3.5%, a fresh multi-year low. That too was in line with the RBNZ’s own forecasts. Tradeable items, which are more influenced by international factors, continued to move in the other direction, rising 0.8% for the quarter and 2.2% for the year, the latter the highest level since Q4 2023 and a tenth above the 2.1% level eyed by the RBNZ.
Stripping out volatile price movements, CPI excluding food, household energy, and vehicle fuels gained 0.8% for the quarter, seeing the increase from a year earlier moderate further to 2.5%. The RBNZ’s own underlying inflation measure, the sectoral factor model, will be released at 2 p.m. Wellington time Monday (midday AEDT).

November RBNZ Cut Remains Fully Priced
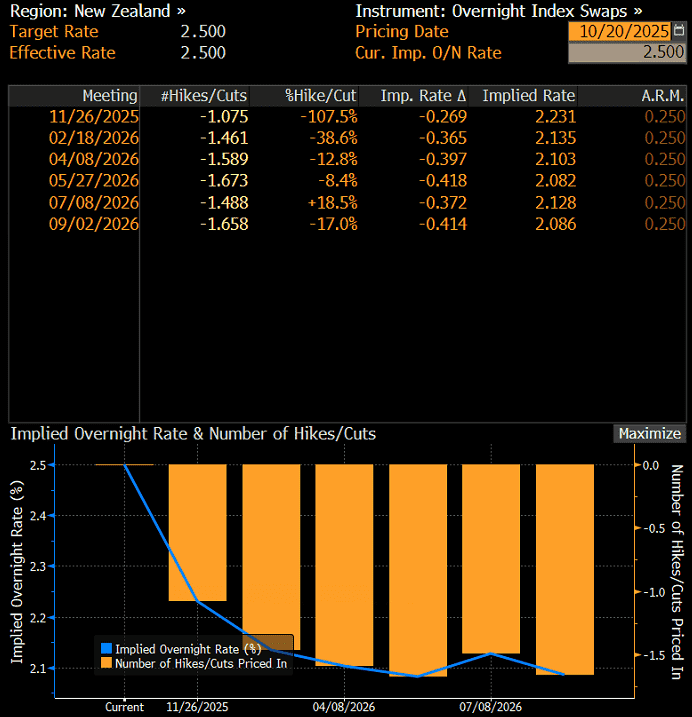
Following the release, another 25 basis point rate cut from the RBNZ in November remains fully priced, with a small risk of a 50. As things stand, markets now see the cash rate bottoming at either 2% or 2.25% this cycle, well below the 5.5% level it peaked at last year.
Source: Bloomberg
While interest rate differentials are no longer a primary driver of movements in the New Zealand dollar, the scale of easing already seen this cycle has been a factor behind the Kiwi’s underperformance against other G10 FX names recently, including the U.S. and Australian dollars.
NZD/USD Indecision Evident
Source: TradingView
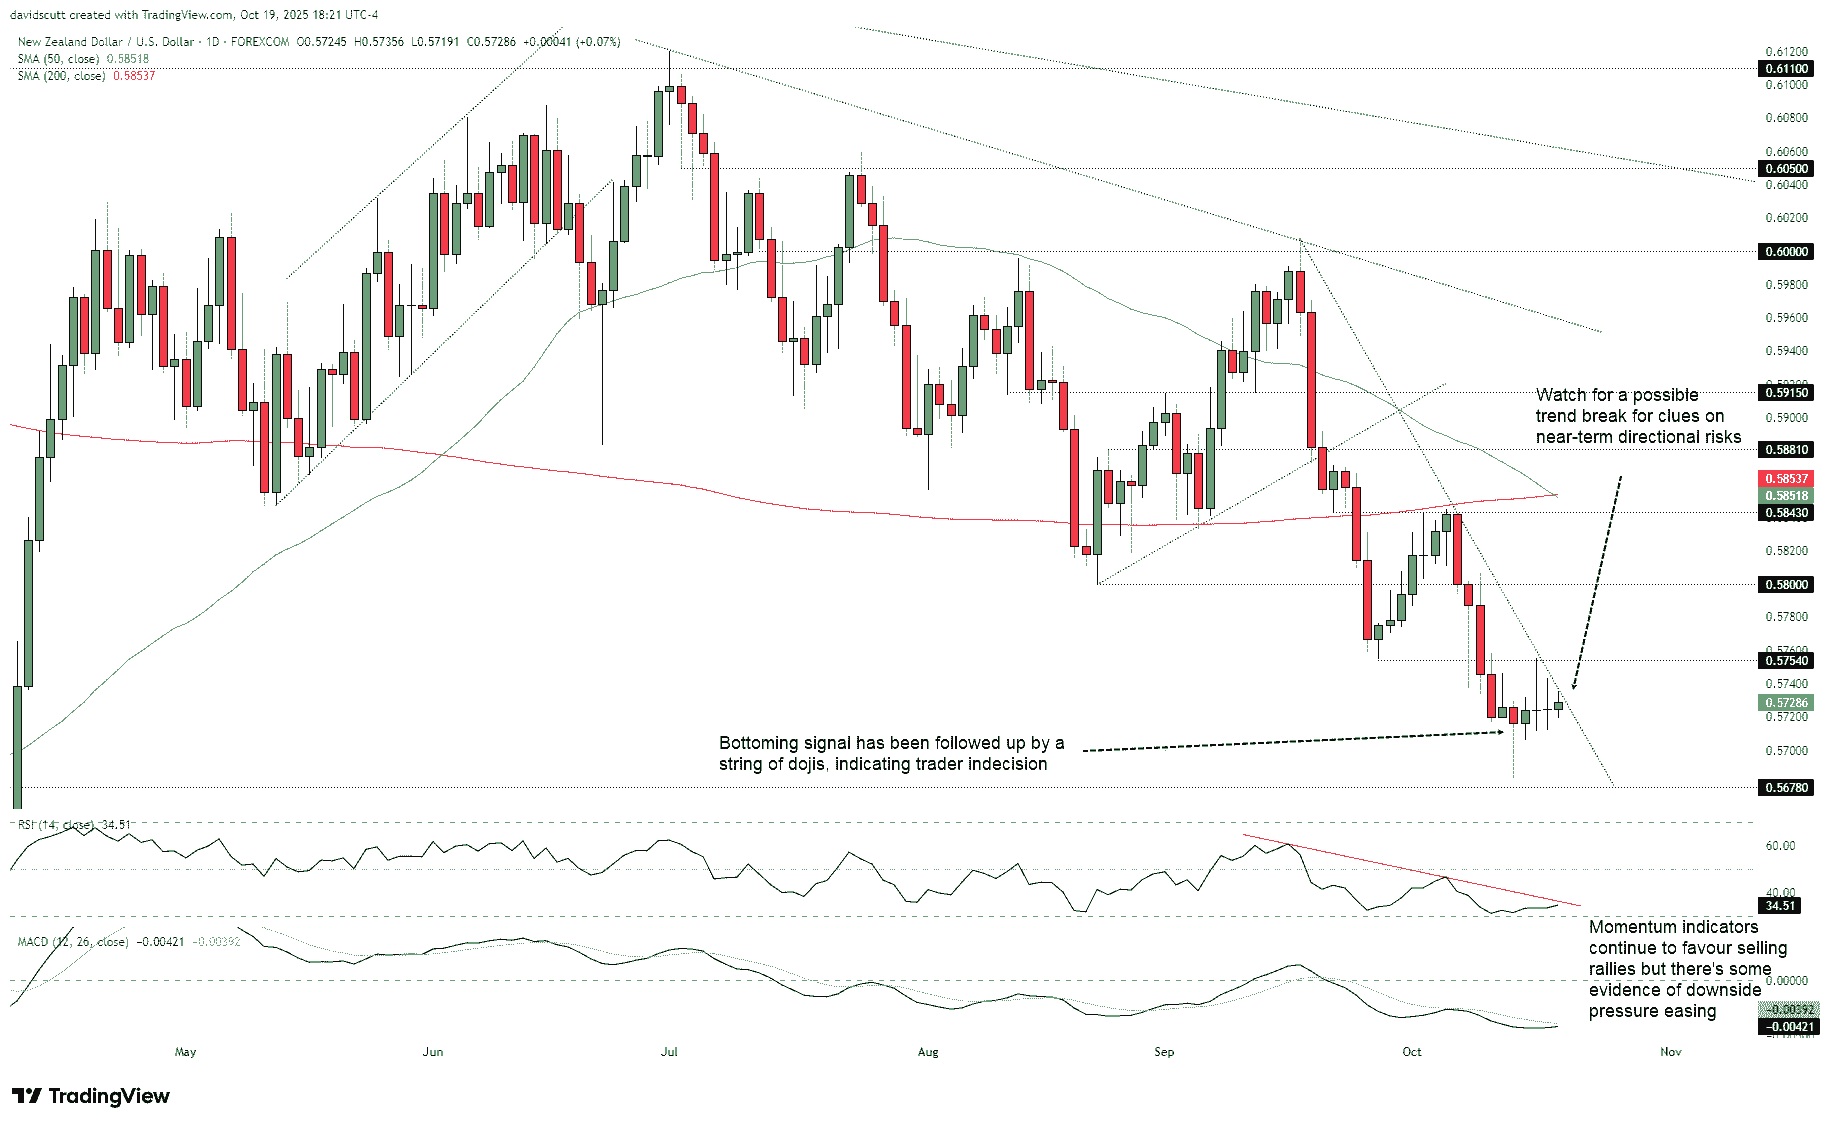
Looking at NZD/USD, the pair remains in a clear downtrend from the high above .6000 set last month. Momentum indicators are also firmly bearish despite showing some signs of bottoming, with RSI (14) also in a downtrend while not yet oversold, and MACD remains deeply negative having already crossed the signal midway through September. Selling rallies is therefore preferred unless the pair can break the September downtrend, which it finds itself bumping up against today.
While the bullish pin that printed on October 14 is a classic reversal pattern, the string of doji candles late last week provides a message of indecision among traders as to whether it was “the low,” keeping two-way directional risks in play for the moment. While we have just seen a death cross with the 50DMA crossing the 200DMA from above, given the signal has a very checkered track record for its predictive powers previously, it’s been overlooked on this occasion.
Should the downtrend be broken, .5754 and .5800 are both nearby resistance levels of note. On the downside, .5678 provided support on multiple occasions earlier this year. The fact we saw a strong reversal from just above it earlier this month suggests it remains relevant to traders.
AUD/NZD Rangebound, Selling Rallies Preferred
Source: TradingView
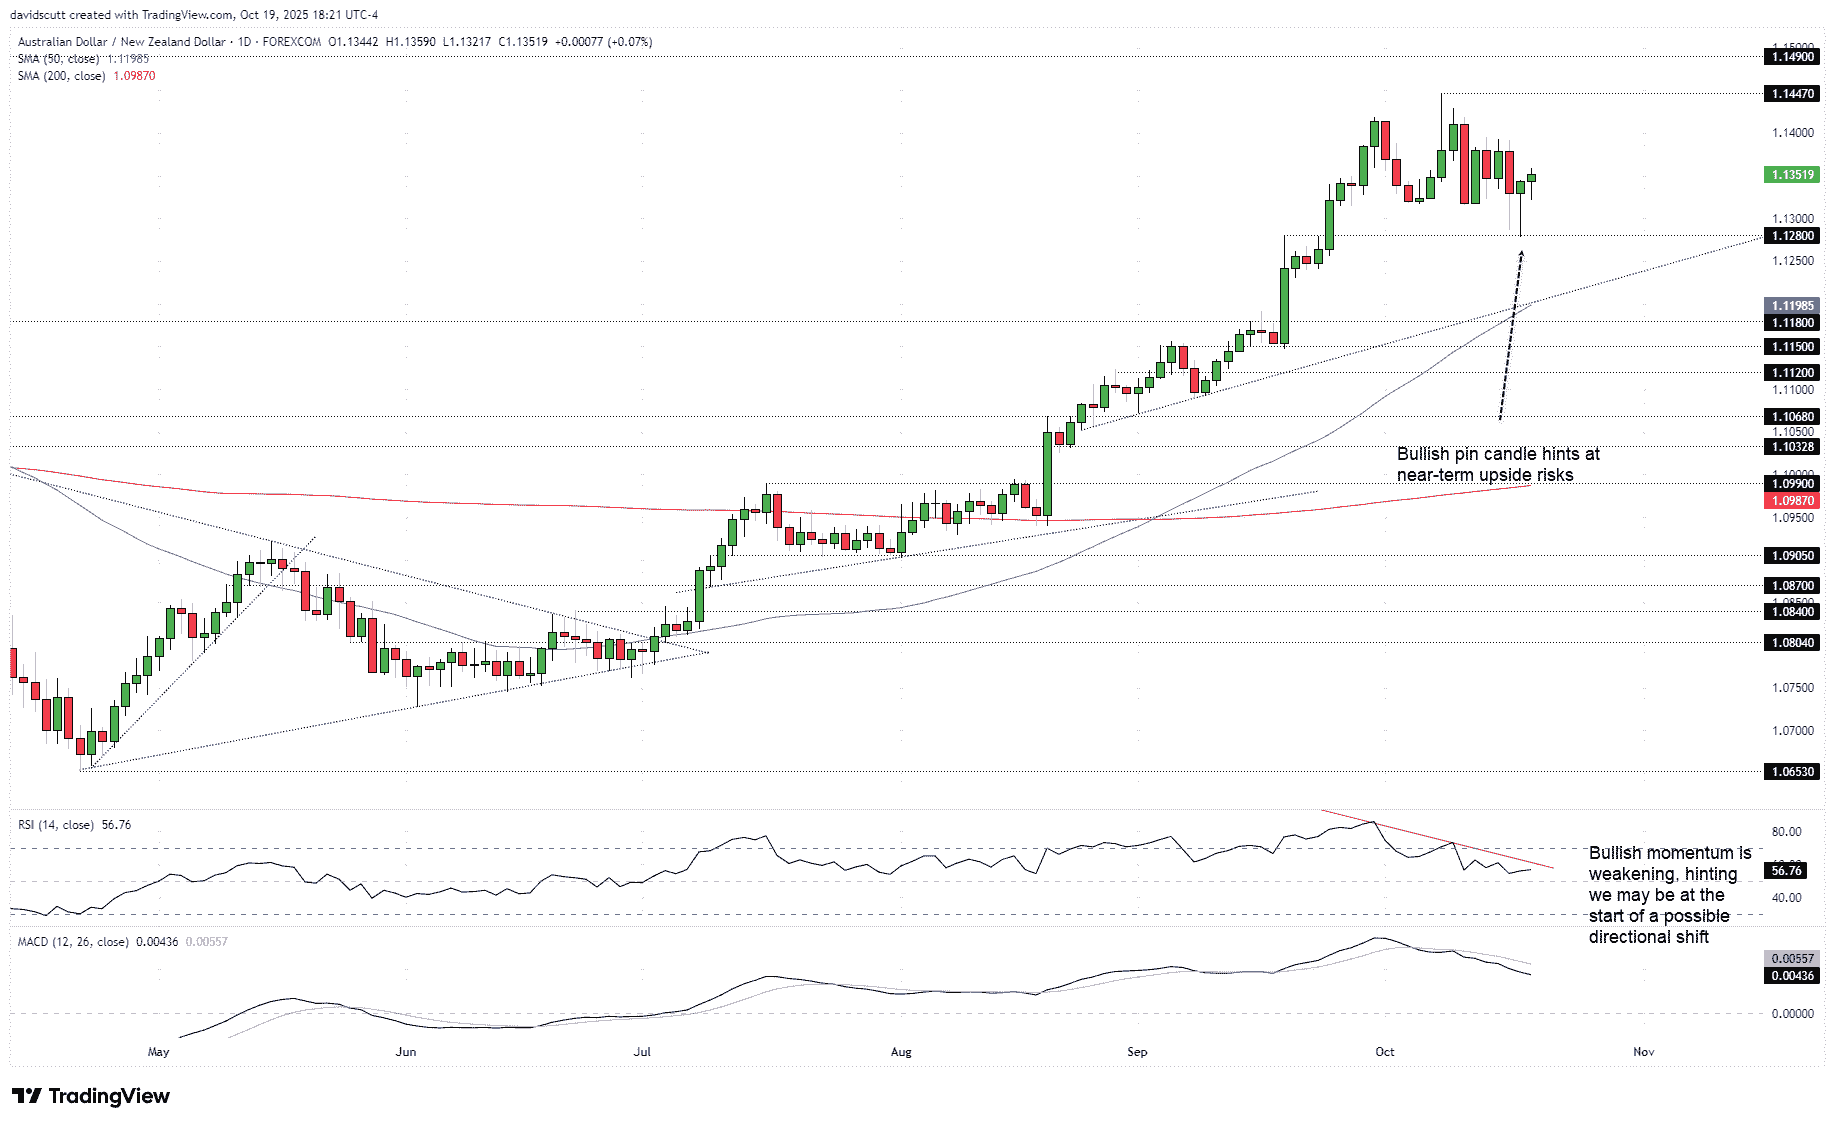
Turning to AUD/NZD, the pair continues to trade in a sideways range with support at 1.1280 on the downside and resistance from 1.1400 up to 1.1447 on the topside. They are the immediate levels of note for traders.
Given the bullish pin candle that printed Friday, near-term directional risks may be skewed higher, putting a retest of the top of the range in play. However, with RSI (14) and MACD revealing diminishing bullish momentum, selling rallies screens as more appealing given how far the pair ran higher in recent months.
Should 1.1280 support be broken cleanly, the 50-day moving average, 1.1180, 1.1150, and 1.1120 are the immediate downside levels to watch.






