Qualcomm (QCOM)
click to enlarge charts
Key Levels (1 to 3 weeks)
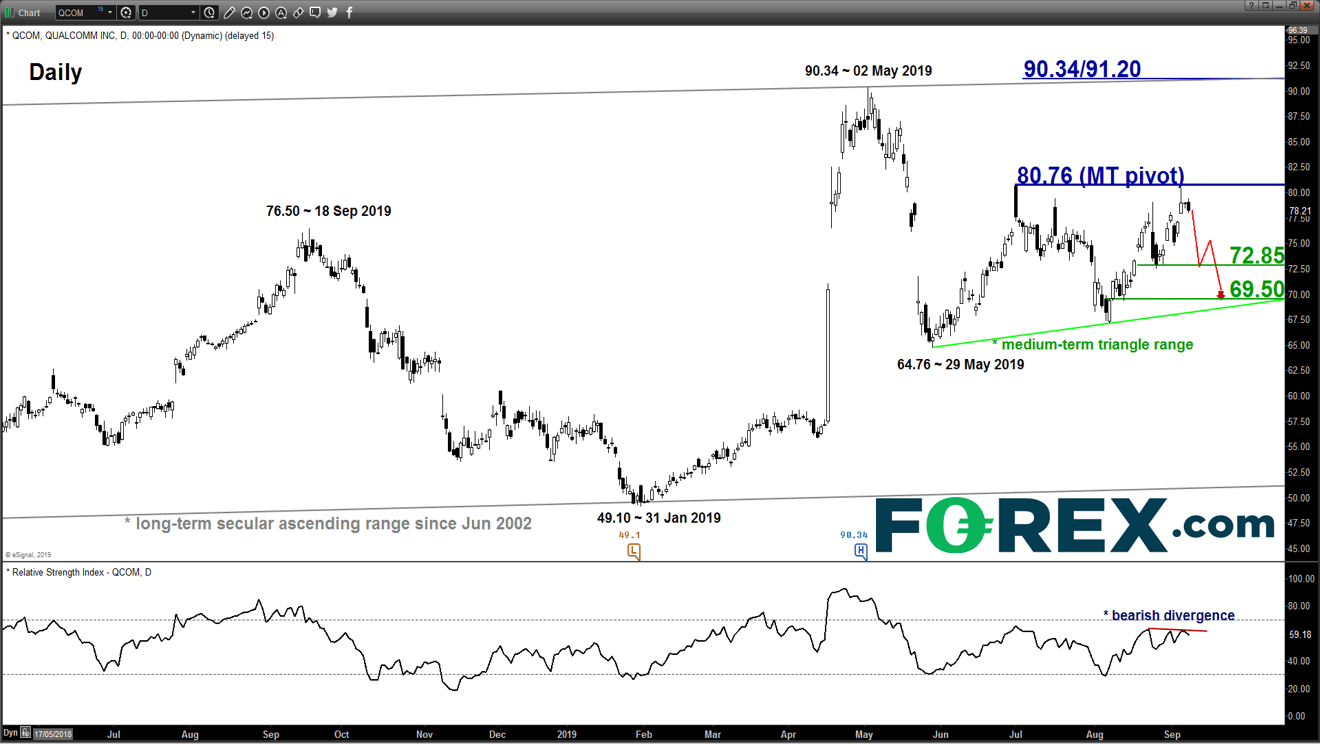
Pivot (key resistance): 80.76
Supports: 72.85 & 69.50
Next resistance: 90.34/91.20
Directional Bias (1 to 3 weeks)
Qualcomm (QCOM), a major U.S. semiconductor stock that has seen an increase in volatility due to the on-going U.S.-China trade war tension. The recent rally has stalled at the upper boundary of a 3-month triangle range configuration. Bearish bias below 80.76 key medium-term pivotal resistance for a further potential push down to target the next supports at 72.85 follow by 69.50. On the other hand, a clearance with a daily close above 80.76 invalidates the bearish scenario for a squeeze up towards the long-term ascending range resistance at 90.34/91.20.
Key elements
- Since its 29 May 2019 low of 64.76, QCOM has been evolving within a medium-term triangle range configuration with the upper limit of the range at 80.76.
- The recent rally of 19.80% from its 67.12 low of 07 Aug 2019 has stalled at the upper limit of the range with a bearish divergence seen in the daily RSI oscillator. These observations suggest that medium-term upside momentum of price action has started to ease.
- The key medium-term support rests at 69.50 which is defined by the lower limit of the triangle range and the 76.4% Fibonacci retracement of the recent push up from 07 Aug low to 05 Sep 2019 high.
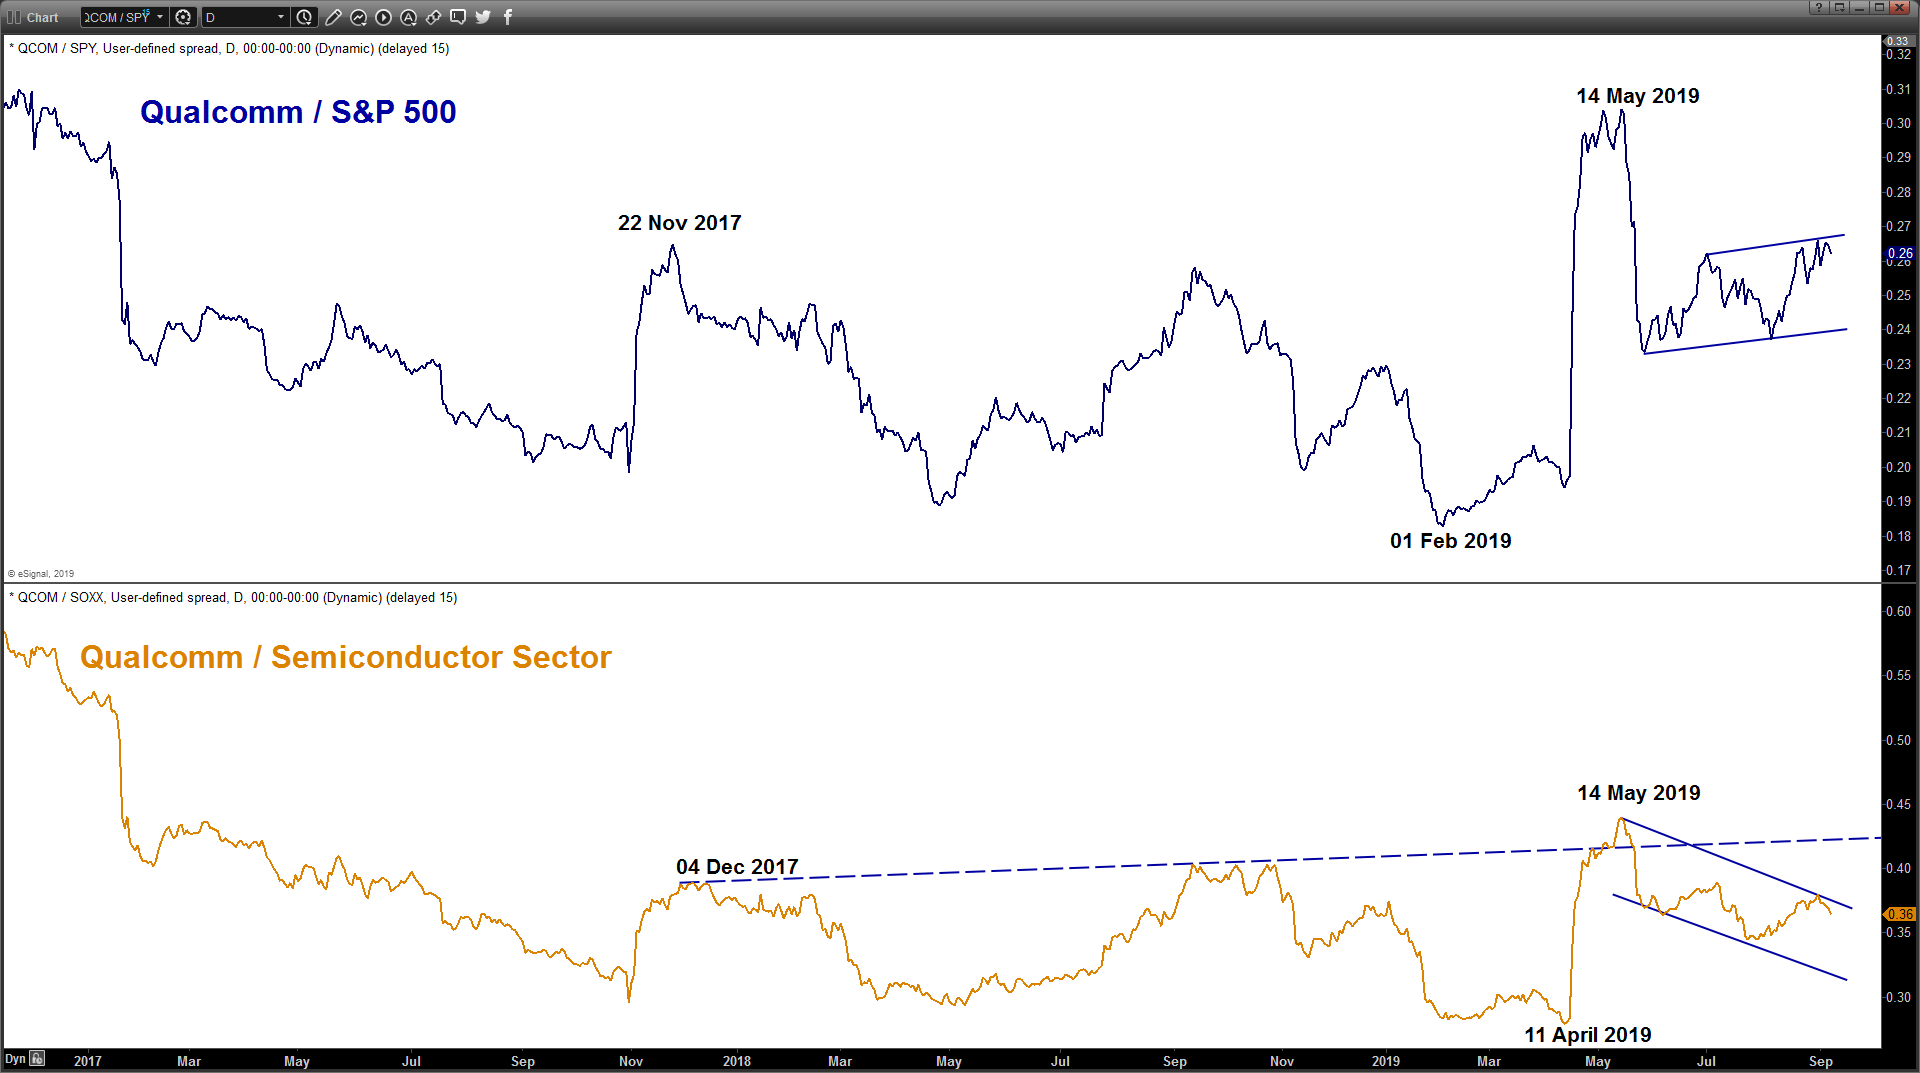
- Relative strength analysis against the market (S&P 500) and its sector (Semiconductor) are suggesting further potential underperformance of QCOM.
Charts are from eSignal