


Following Monday’s sharp recovery, US futures were trading higher alongside European markets. While sentiment towards equity markets continue to remain positive for the time being, that’s not to say things will remain rosy in the coming weeks. The S&P 500 outlook could start to deteriorate in the near-term amid warnings over sky-high valuations against a backdrop of weakening economy. Should worries about overstretched valuations start to weigh on a few high flying tech names, most of which have been supported by their latest earnings results, then the major indices could start to show bearish signs. Meanwhile, today’s focus will turn to the ISM services report for July, where a modest uptick is expected. Should that materialise, it could give markets some further short-term support following Friday’s NFP-related wobble. We’ll also be hearing from Fed officials Susan Collins and Lisa Cook on Wednesday – and their comments may well shape rate cut expectations heading towards the autumn. But all told, this is a quiet week for economic data. Another catalyst to drive heightened volatility is Donald Trump, who looks to be targeting BRICs nations via trade tariffs and economic sanctions.
What now after the latest bounce?
The S&P 500 futures bounced back around 1.5% on Monday, clawing back most of Friday’s losses on hopes the Fed will cut rates sooner rather than later. Futures were up slightly this morning, with European shares joining in too. The UK’s FTSE 100 for example was lifted by the likes of BP and Smith & Nephew after upbeat earnings and buyback plans. Still, the enthusiasm was somewhat restrained, with US futures unable to sharply expand on yesterday’s bounce. Obviously, that could change once the cash markets open, but markets could turn more volatile in the weeks ahead.
Seasonality factors bode ill for S&P 500 outlook
As equity indices continue to rise to elevated levels, so does the risk of a pullback amid stretched valuation concerns and technical overbought conditions. Meanwhile, seasonality factors are also adding to the mix with August and September historically not a great period for US equity prices. According to Bloomberg, looking at data over the past 30 years, the S&P 500 has tended to lose around 0.7% in each of these months. This doesn’t bode well for the near-term S&P 500 outlook, especially compared with an average gain of 1.1% in other months.
Markets in need of fresh catalysts
So, are we about to see heighted market volatility soon? So far, the dips since markets bottom in April have been shallow and bought quickly, including Friday’s one. While I wouldn’t bet against a bigger fall in the coming weeks, my assumption would be that if markets were to decline, this too would be quickly bought. For now, though, the bulls are still in control, but it is becoming increasingly difficult to justify continued buying without any fresh catalysts.
Indeed, optimism related to trade deals and Trump’s fiscal agenda have been priced in, while the overall positive earnings season also helped keep stocks on the front foot.
S&P 500 outlook: Technical analysis and levels to watch
The technical S&P 500 outlook is still positive given the higher highs and higher lows observed since markets bottomed in April when the US benchmark index found solid support from the long-term bullish trend line. Fast forward four months and the rally is still going, but with a few warnings signs of exhaustion. This was underscored, for example, by the sizeable wobble at the end of last week. The daily RSI has since moved below the overbought levels of >70, but the longer-term monthly RSI (not shown) is still above this threshold which will need to unwind eventually either through time of price.
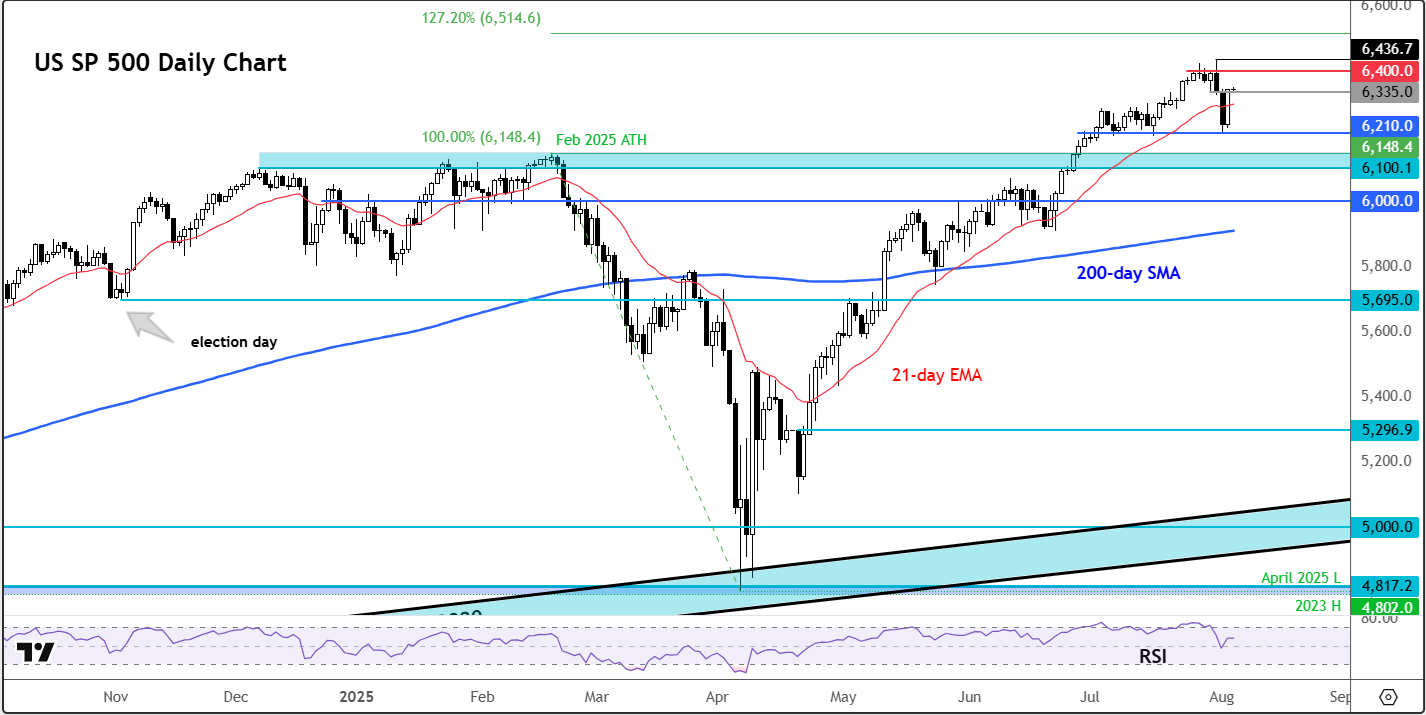
Our US SP 500 index, which is based on the underlying S&P 500 futures, bounced right where it needed to on Friday to keep the bulls happy: 6210. This level was important support previously in early July and it held once again. Moving forward, the bulls will need to hold their ground above this level if they want to maintain control. Lose this and a size dip could be the outcome, with interim support levels seen at 6148 and 6100 initially, ahead of the key 6,000 handle next.
In terms of resistance levels to watch, well the 6335 level was a key hurdle that needed to hold to keep the bears happy, given that this was the last support pre breakdown on Friday. At the time of writing though, the index was trading above this level, suggesting the bears were losing ground. Let’s see, though, where we are at when the day’s trading session is over. Below this level would be a mildly bearish sign, above it bullish. Next resistance is seen at 6,400 and then last week’s all-time high of 6436 will be in focus next.
-- Written by Fawad Razaqzada, Market Analyst
Follow Fawad on Twitter @Trader_F_R






