
US Dollar Index Technical Outlook: USD Short-term Trade Levels
- The U.S. Dollar has reversed nearly 1.6% from major resistance, bringing DXY back toward a pivotal technical support zone. The weekly opening range is taking shape just above.
- A break below this threshold would threaten resumption of the October decline and expose a deeper correction.
- Bulls need to reclaim near-term resistance to suggest a more meaningful low is in place and revive the broader recovery.
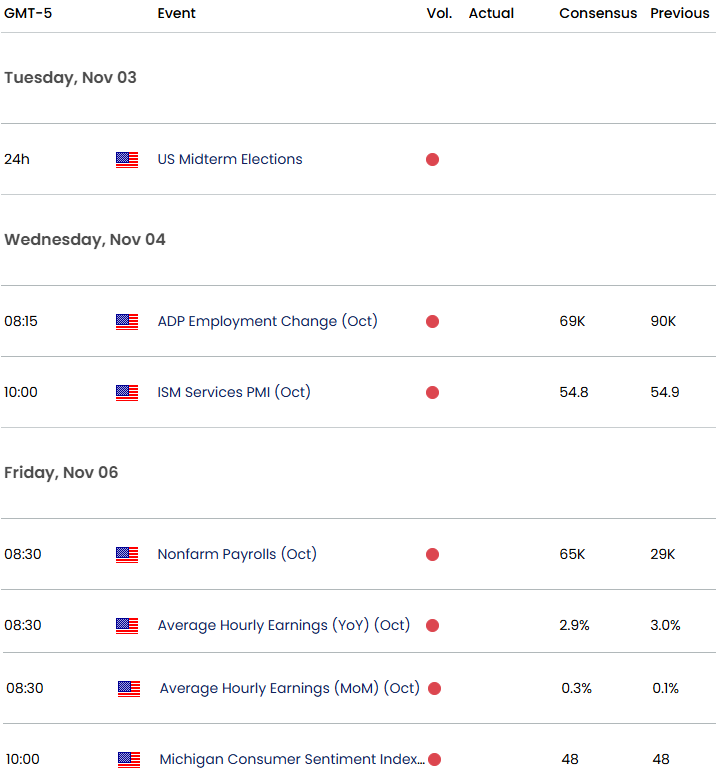
- The U.S. midterm elections, ISM services, ADP employment, and Friday's Nonfarm Payrolls report headline event risk as markets reassess the Fed's December rate outlook.
- DXY Resistance 101.97, 102.26 (key), 102.53- Support 101.51/59 (key), 100.99, 100.75
The U.S. Dollar is struggling to regain its footing after a sharp rejection from major resistance, leaving DXY at a critical technical crossroads as November trade gets underway. The near-term structure has deteriorated, but sellers still need a decisive break of support to confirm that a larger correction is unfolding. Political uncertainty and a packed U.S. economic calendar could drive significant volatility in Treasury yields, with the upcoming employment figures likely to play a key role in shaping expectations for another Fed hike in December. With the weekly opening range taking shape, the next directional break could offer important guidance for the Dollar heading into the remainder of the month. Battle lines drawn on the DXY short-term technical charts.
Review my latest Weekly Strategy Webinar for an in-depth breakdown of this US Dollar technical setup and more. Join me live Mondays at 8:30am EST and tune in to the Opening Bell Tuesday through Friday at 9:30am EST for continued market coverage throughout the week.
US Dollar Index Price Chart – USD Daily
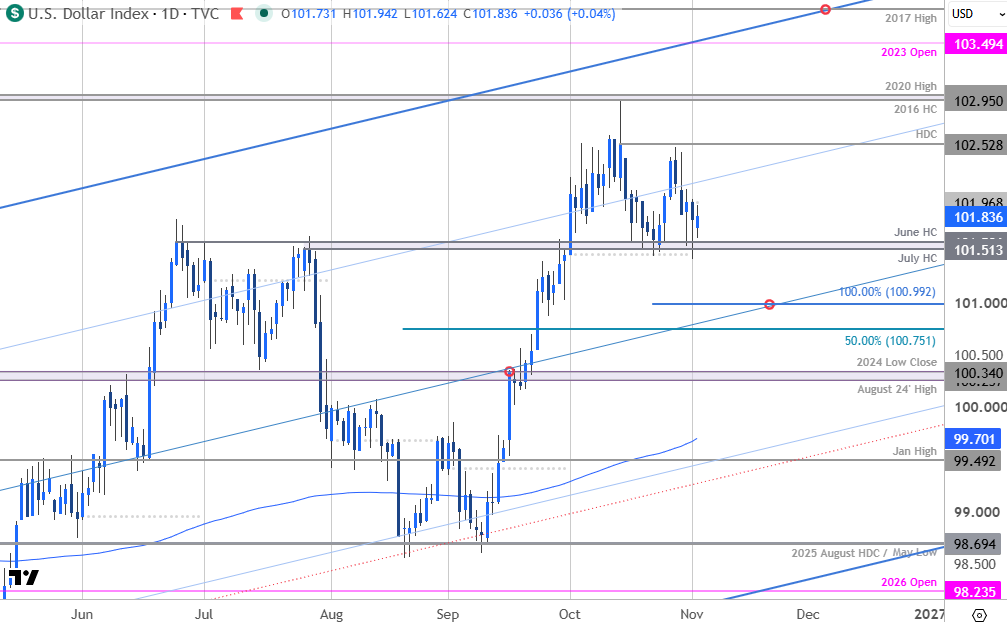
Chart Prepared by Michael Boutros, Sr. Technical Strategist; DXY on TradingView
Technical Outlook: In last month’s US Dollar Short-term Outlook we noted that DXY was rangebound below near-term resistance and that, “From a trading standpoint, losses would need to be limited to 101.77 IF price is heading higher on this stretch with a close above 102.42 needed to fuel the next leg higher in price.” The index broke higher two days later, extending more than 1.2% from the monthly low before stalling at major resistance at the 2016 closing high and 2020 swing high at 102.95/95. A decline of nearly 1.6% off the high has brought DXY into key support into the start of the month at the July / June high closes at 101.51/58. The immediate focus is on possible inflection off this pivot zone with the weekly opening range taking shape just above.
US Dollar Index Price Chart – USD 240min
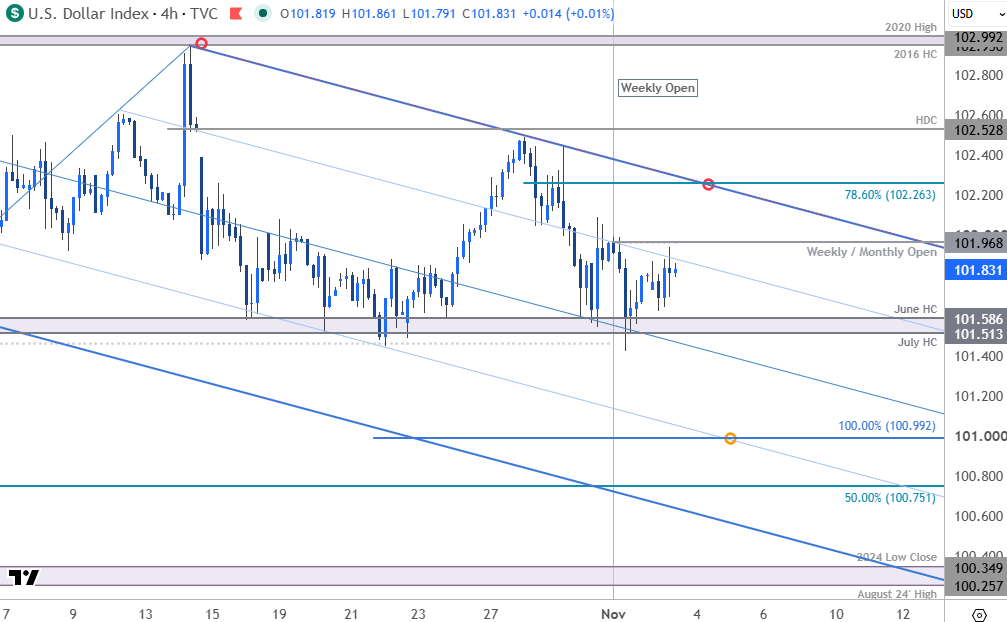
Chart Prepared by Michael Boutros, Sr. Technical Strategist; DXY on TradingView
Notes: A closer look at U.S. Dollar price action shows DXY trading within the confines of a descending pitchfork extending off the October high with the weekly range forming just above the median line. Weekly / monthly open resistance is eyed at 101.97 with near-term bearish invalidation set to the 78.6% retracement of the most recent decline at 102.26. Note that the upper parallel converges on this level over the next few days and a breach / daily close above would be needed to suggest a more significant near-term low is in place. Subsequent resistance objectives are eyed at the yearly high-day close at 102.53 with key resistance steady at 102.95/99.
A break / daily close below this key pivot zone would threaten resumption of the October downtrend. The next major technical consideration rests with the 100% extension of the decline off the yearly high at 100.99- this level converges on the 25% parallel later this week. Look for a larger reaction there IF reached. Subsequent support rests with the 50% retracement of the August rally at 100.75 and the August 2024 high / 2024 low close at 100.26/35.

Bottom line: The U.S. Dollar is trading just above pivotal support with the weekly range in view ahead of major event risk. From a trading standpoint, the focus is on a breakout of the weekly range for guidance- rallies would need to be limited to 102.26 IF price is heading lower on this stretch with a close below 101.51 needed to fuel the next leg of the decline.
USD event risk is concentrated around the U.S. midterm elections and the potential for a sharp reaction in the dollar, Treasury yields and broader risk sentiment. The market impact will depend on the balance of power in Congress and the implications for the administration’s fiscal, trade, and policy agenda, with an uncertain or contested result likely to increase volatility. Attention then shifts to ISM services, ADP employment, and Friday’s Nonfarm Payrolls report, which will help determine whether the Fed’s next move is another hike or an extended hold. Strong data would keep policy expectations tilted toward further tightening, while weaker figures would make a near-term hike less likely and could further temper demand for the Dollar. Stay nimble into the releases and watch the weekly close for guidance. Review my latest US Dollar Weekly Forecast for a closer look at the longer-term DXY technical trade levels.
Key US Economic Data Releases
Economic Calendar - latest economic developments and upcoming event risk.
Active Short-term Technical Charts
- British Pound Short-term Outlook: GBP/USD Breakout Rally Tests Major Resistance
- Euro Short-term Outlook: EUR/USD Rebound Faces Critical Test After Trend Break
- Gold Price Short-term Outlook: XAU/USD Holds Critical Support as Breakout Nears
- Canadian Dollar Short-term Outlook: USD/CAD Five-Week Rally Hits a Wall at Major Resistance
- Japanese Yen Short-term Outlook: USD/JPY Breakout Risk Builds Below 200-Day Average
- Australian Dollar Short-term Outlook: AUD/USD Rebound Challenges September Downtrend
- Swiss Franc Short-term Outlook: USD/CHF Rebound Tests Broken Uptrend
Written by Michael Boutros, Senior Technical Strategist
Follow Michael on X @MBForex