
Weekly Technical Trade Levels on USD Majors, Commodities & Stocks
- USD technical trade setups we are tracking this week
- Next Weekly Strategy Webinar: Monday, October 13 at 8:30am EST
- Review the latest Video Updates or Stream Live on my YouTube playlist.
In this webinar we take an in-depth look at the technical trade levels for the US Dollar (DXY), Euro (EUR/USD), British Pound (GBP/USD), Australian Dollar (AUD/USD), Canadian Dollar (USD/CAD), Japanese Yen (USD/JPY), Swiss Franc (USD/CHF), Gold (XAU/USD), Crude Oil (WTI), and Equity Indices. These are the levels that matter on the technical charts into the weekly open / monthly close.
Canadian Dollar Price Chart – USD/CAD Daily
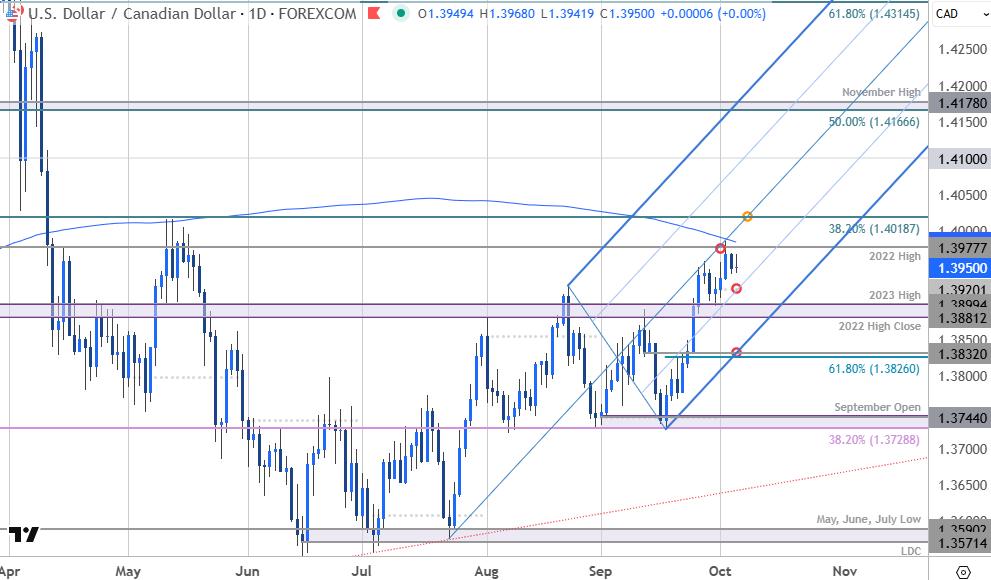
Chart Prepared by Michael Boutros, Sr. Technical Strategist; USD/CAD on TradingView
Notes: USD/CAD is trading at key resistance into the start of the week at 1.3977/85- a region defined by the 2022 high, the May high-close and the 200-day moving average. Risk for possible inflection exhaustion / inflection off this zone in the days ahead. Monthly open support rests at 1.3920 and is backed by the 2022 high-close / 2023 high at 1.3881/99. Broader bullish invalidation rests with the 61.8% retracement / September 11 reversal close at 1.3826/32 with a breach / daily close above the 38.2% retracement of the yearly range at 1.4019 needed to fuel the next major leg of the advance. Keep in mind we get the release of Canada employment data on Friday. Review my latest Canadian Dollar Short-term Outlook for a closer look at the near-term USD/CAD technical trade levels.
Japanese Yen Price Chart – USD/JPY Daily
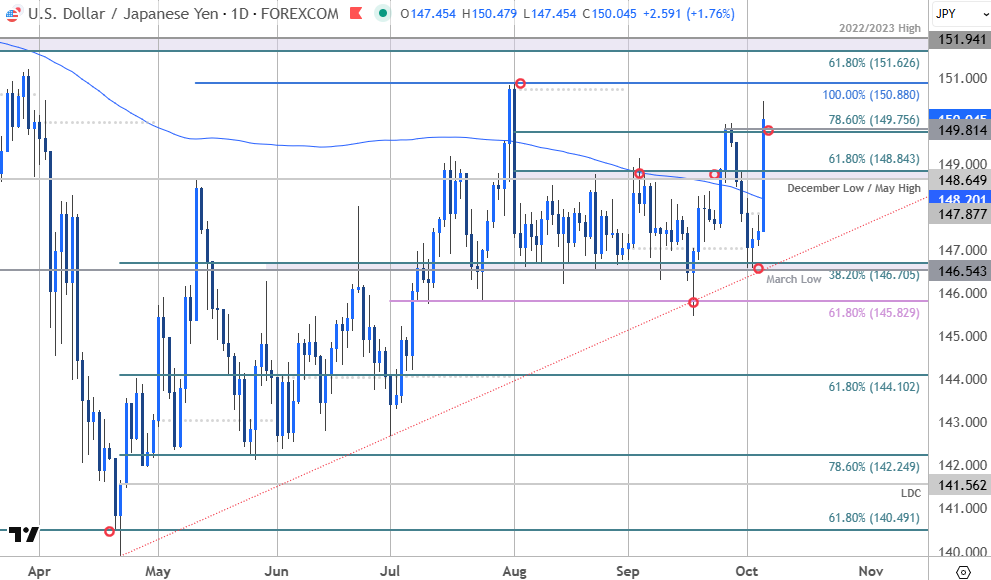
Chart Prepared by Michael Boutros, Sr. Technical Strategist; USD/JPY on TradingView
Notes: USD/JPY surged more than 2% into the weekly open with price building on a rebound off critical support last week at 146.54/70- a region defined by the March low, the 38.2% retracement of the April advance and the April trendline. The immediate focus is on today’s close with respect to this threshold with a close above needed to keep the advance viable in the days ahead. Near-term bullish invalidation now raised to the December low / May high / 61.8% retracement at 148.65/84. Subsequent resistance objectives now eyed at the 100% extension of the April rally at 150.88 and the 61.8% retracement of the yearly range / 2022 & 2023 highs at 151.62/94.

Gold Price Chart – XAU/USD Daily
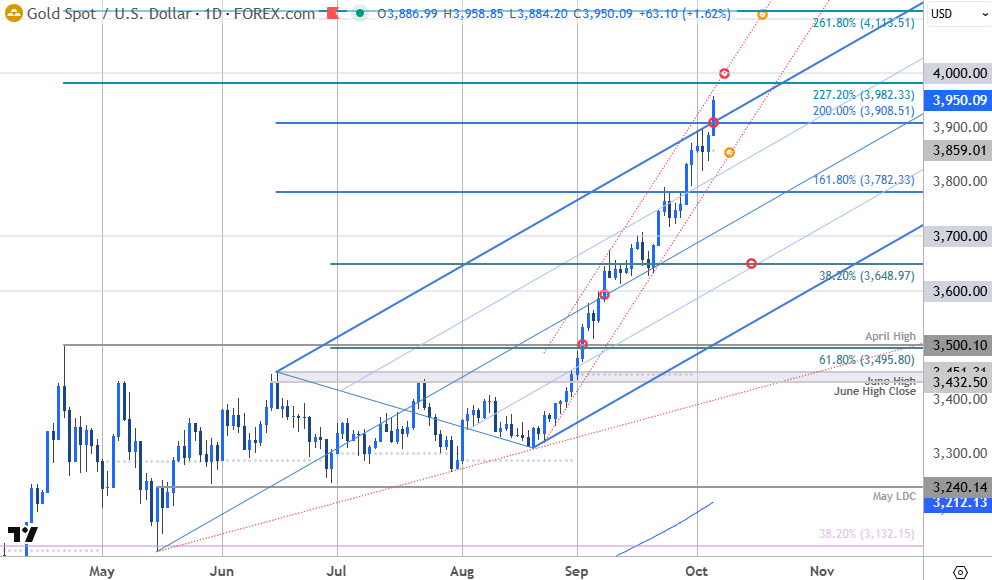
Chart Prepared by Michael Boutros, Sr. Technical Strategist; XAU/USD on TradingView
Notes: Gold is attempting to break above confluent uptrend resistance today at the 200% extension of the May advance at 3908. The advance is now eyeing the next hurdle at the 2.272% extension of the May decline at 3982/4000- note that a parallel of the August advance (red) converges on this threshold over the next few days and highlight the technical significance of this region this week. Risk for exhaustion / price inflection into this zone with a break / close above needed to fuel the next major leg of the advance. Initial support rests back at 3908 and is backed by near-term bullish invalidation at the objective monthly open at 3859. A topside breach above this channel exposes subsequent resistance at the 2.618% extension at 4000/113.
Economic Calendar – Key USD Data Releases
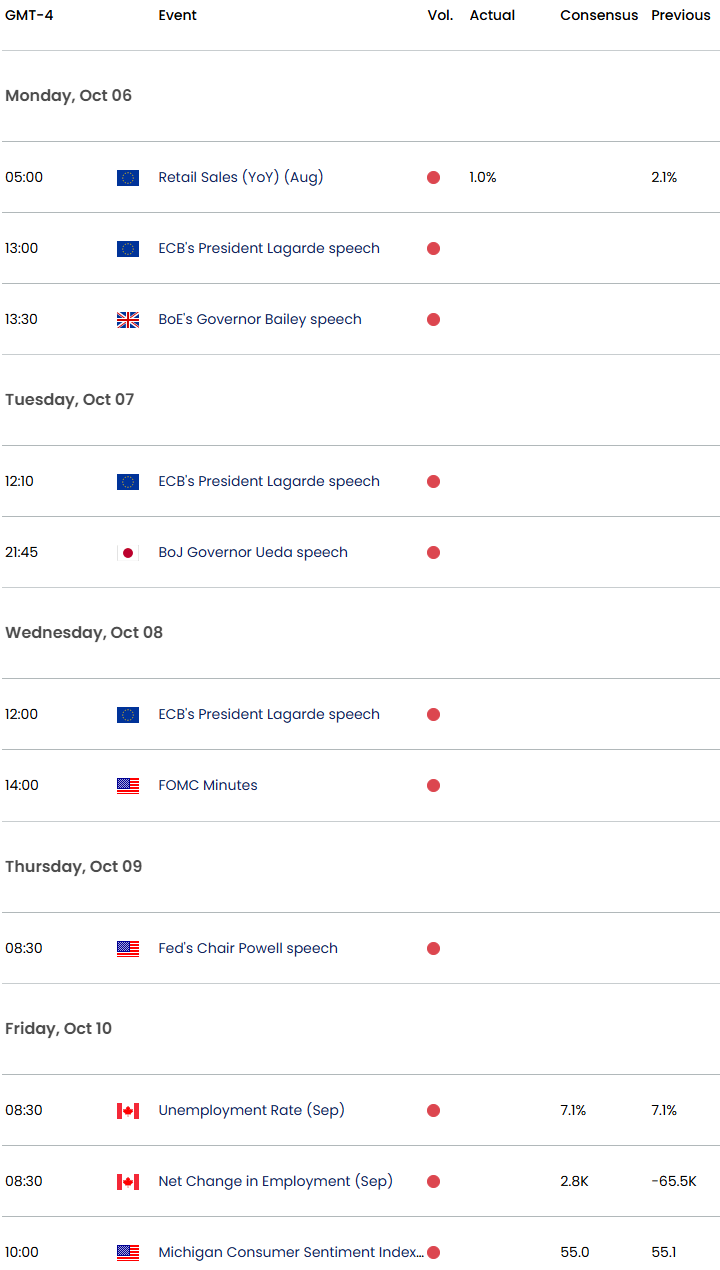
Economic Calendar - latest economic developments and upcoming event risk.
--- Written by Michael Boutros, Sr Technical Strategist
Follow Michael on X @MBForex