
The new trading week is underway and the Nasdaq 100 is once again displaying a meaningful bullish bias in the short term. This can be seen in the index's recent performance, which has gained more than 2.1% over the last three trading sessions, returning once again to record-high territory.
For now, buying pressure has been supported primarily by the performance of some of the index's largest components. This has helped sustain market confidence despite a bond market that continues to offer increasingly attractive yields. As long as positive expectations surrounding key companies remain intact, buying momentum could continue to play an important role in the sessions ahead. Even so, it remains important to remember that a return of concerns surrounding a more aggressive Federal Reserve could once again favor a more cautious environment around Nasdaq.

Can Confidence Continue to Hold Up?
Last week ended with the release of the U.S. Nonfarm Payrolls (NFP) report. The data showed the creation of just 29,000 jobs, significantly below the nearly 90,000 expected by the market. This result reinforced the perception of a slowing labor market and reduced part of the room available for a more aggressive Federal Reserve in the near term.
What remains particularly interesting is that this development has not reduced the attractiveness of the bond market. U.S. Treasury yields continue to trade above 5.3%, levels not seen in decades. Under normal circumstances, this would tend to reduce demand for risk assets such as Nasdaq, as investors find greater incentives in markets perceived as more stable.
For much of the past several months, this relationship was clearly visible, with rising bond yields coinciding with a loss of momentum across equity markets. However, the current environment appears somewhat different. Despite the continued rise in yields, Nasdaq has also continued to advance and has managed to return to record highs. This suggests that the inverse relationship observed in recent months has temporarily weakened.
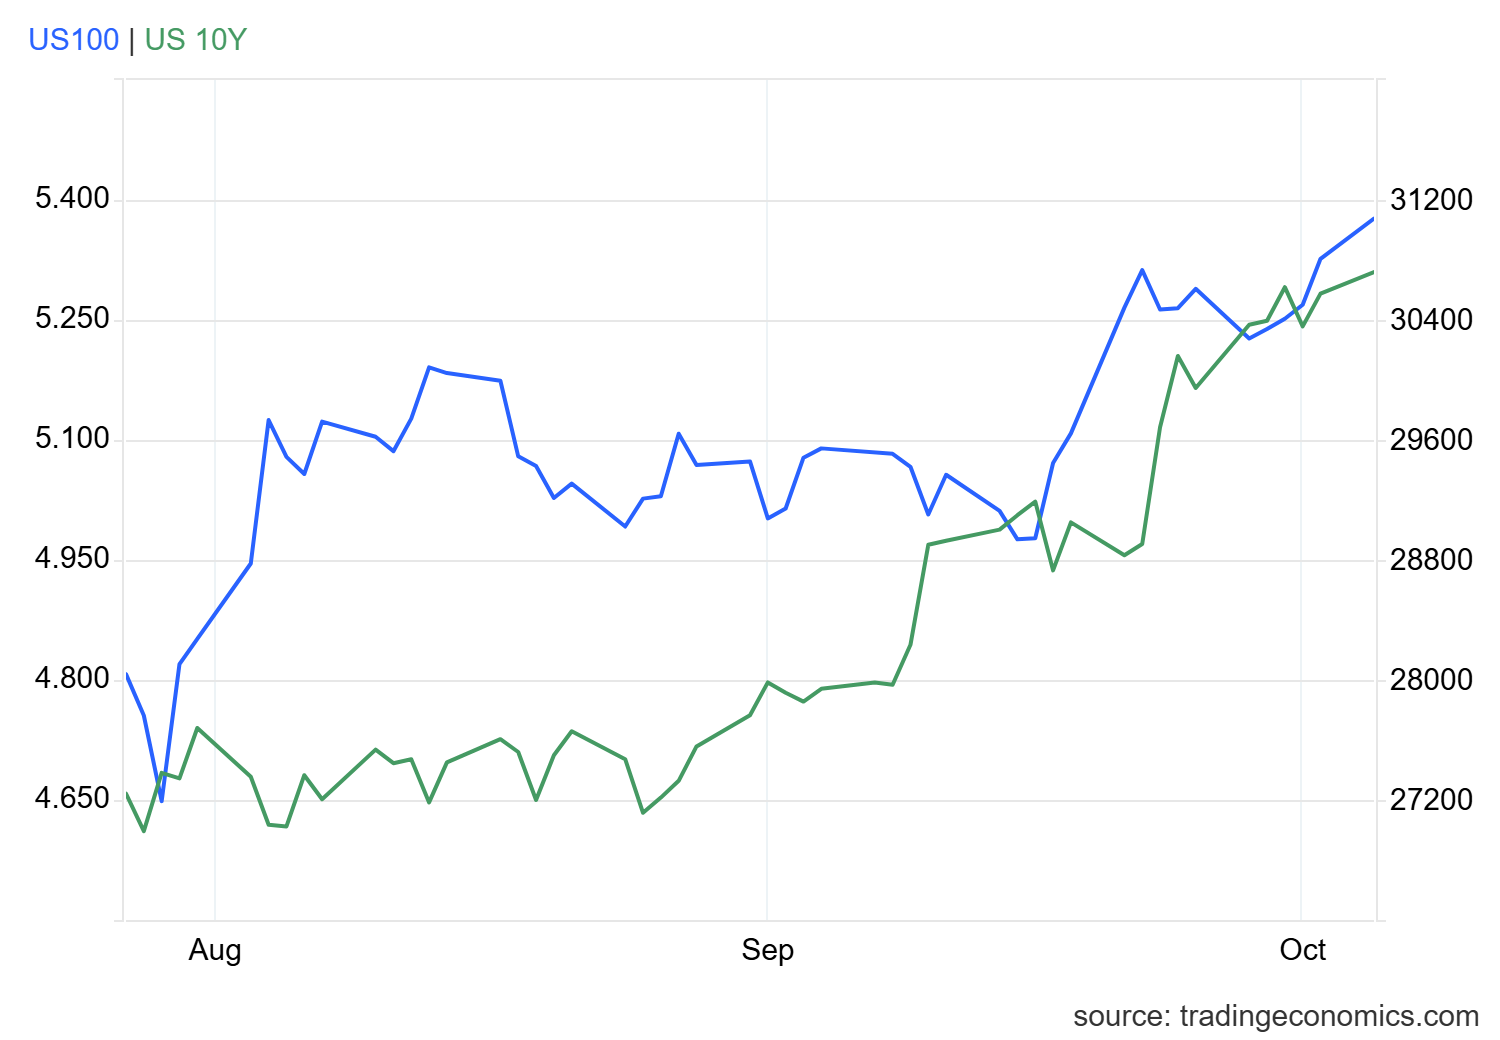
Source: TradingEconomics
This development is important because the equity market appears to be resisting the growing appeal of the bond market in the short term. However, that resilience seems to be driven primarily by the internal performance of Nasdaq components. At the start of the week, several major names within the index are posting strong gains, with SpaceX advancing more than 6.0%, while companies such as Nvidia, Microsoft, and Meta are each recording gains close to 2.0%.
These moves are being supported by company-specific catalysts. In the case of SpaceX, momentum has been fueled by positive comments from Morgan Stanley, which maintains an optimistic outlook and higher valuation targets for the stock. A similar situation can be observed in Microsoft, following upward target price revisions from firms such as Melius Research.
Meanwhile, Nvidia continues to benefit from favorable expectations surrounding artificial intelligence infrastructure demand, while Meta is attracting confidence through the potential development of new AI-related monetization channels beyond its traditional advertising business.
Overall, Nasdaq’s largest constituents continue to develop within a favorable environment of appreciation and short-term optimism. This has allowed the index to maintain momentum even as bond yields continue to rise, reflecting that company-specific and sector-related drivers are currently outweighing concerns surrounding higher interest rates.
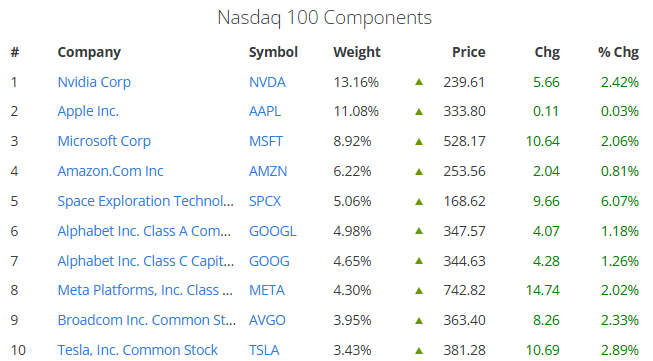
Source: Slickcharts
Taking all of this into account, Nasdaq’s recent strength appears to be driven more by corporate and sector-specific factors than by broader macroeconomic developments. Positive expectations surrounding artificial intelligence remain one of the most important drivers of confidence across the equity market. As long as these themes remain intact, buying pressure could continue to play a significant role in the short term.
That said, it is also important to remember that the index showed signs of weakness in previous weeks whenever the bond market became more attractive and expectations of a more aggressive Federal Reserve increased. For that reason, if these factors begin to regain relevance in the coming weeks, they could once again favor a more indecisive environment around the Nasdaq 100.
Nasdaq 100 Technical Forecast
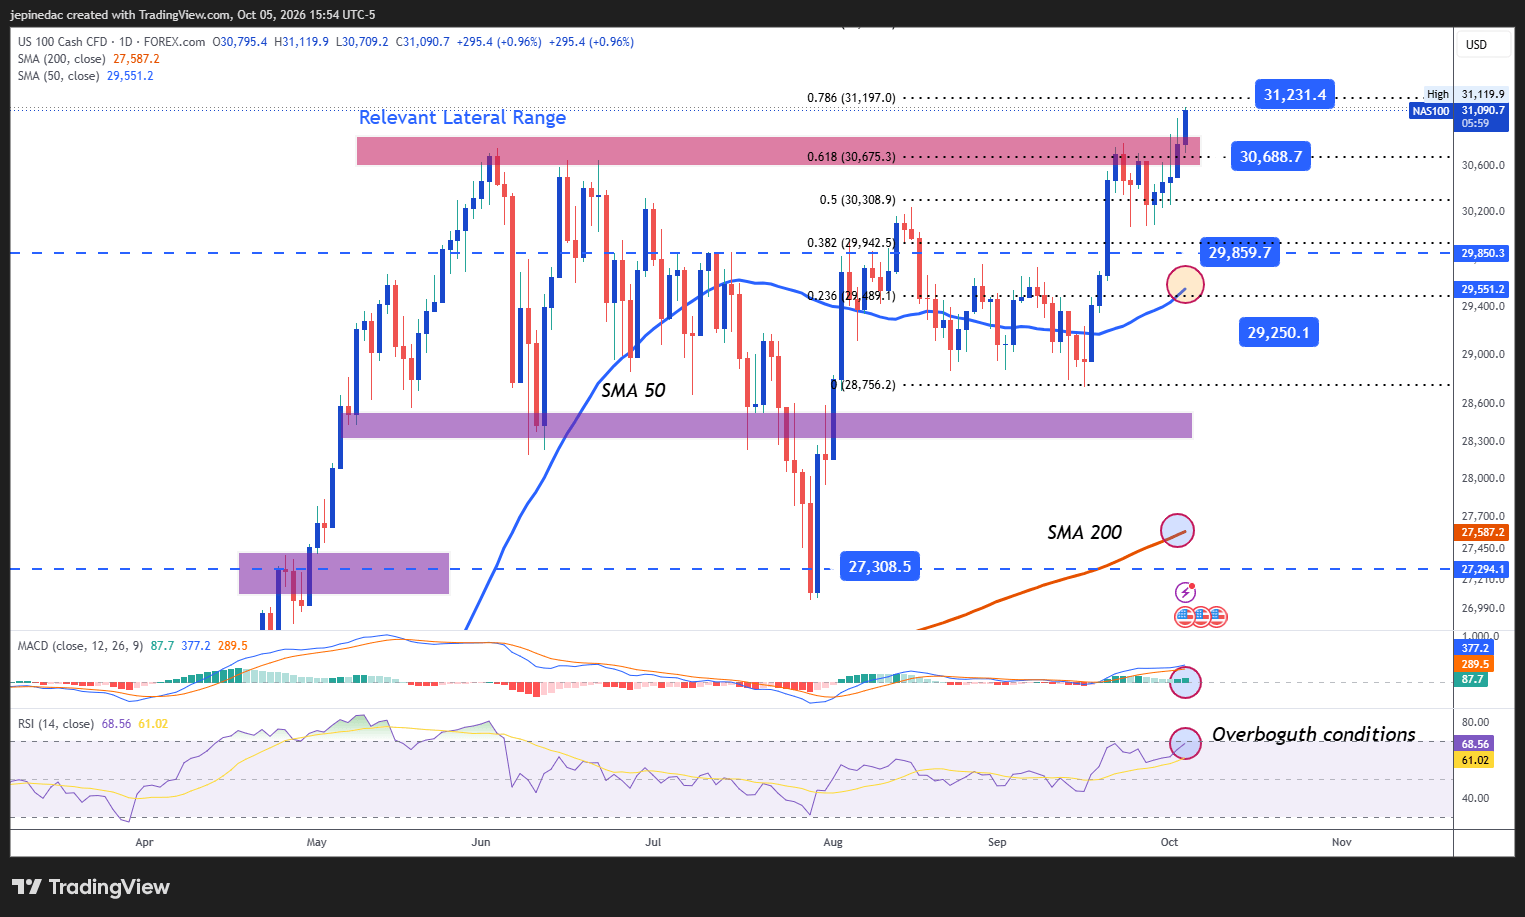
Source: StoneX, Tradingview
- New highs are beginning to emerge: Over recent months, Nasdaq price action had largely remained contained within a broad trading range that served as the dominant technical structure on the chart. However, the latest recovery is beginning to challenge that formation. If new highs continue to establish themselves consistently, a clearer breakout could begin to develop and open the door to a more structured short-term bullish trend in the weeks ahead.
- MACD: The MACD histogram continues to trade above the 0 neutral line, a reading that reflects positive momentum within short-term moving averages. As long as this behavior remains intact, the bullish bias could continue to play an important role in the index's recent price action.
- RSI: The RSI presents a similar picture, remaining above the 50 neutral level and reflecting the presence of sustained buying momentum. However, the indicator is also moving closer to the 70 overbought threshold, a situation that could signal a recent excess in demand and open room for potential short-term pullbacks.
Key Levels:
- 31,200 Points – Key Resistance: In the absence of higher historical price references, this remains one of the most important upside barriers to monitor. The level coincides with the 78.6% Fibonacci extension based on the prevailing trend. Price action that manages to consolidate above this zone could reinforce bullish momentum and favor the development of a more structured uptrend during the coming weeks.
- 30,688 Points – Near-Term Barrier: This level corresponds to the Nasdaq's previous record-high zone and could now become the primary reference to monitor in the event of short-term corrective declines.
- 29,800 Points – Key Support: This area coincides with the 38.2% Fibonacci extension and is also located near the 50-period simple moving average. Price action that moves back toward this level could once again highlight a lack of direction and help maintain a broader consolidation phase as the dominant structure on the chart.
Written by Julian Pineda, CFA, CMT – Market Analyst
Follow him on: @julianpineda25