The US Dollar is testing a breakout after the earlier-week liquidity sweep at support. It was the 99.68 level that has so far set the high as bulls haven’t yet shown a willingness to test the very obvious resistance sitting at the 100-100.22 area in the DXY. Tomorrow brings a series of data points and the Core PCE release carries a lot of weight as this is the Fed’s preferred inflation gauge but given the strong recent correlation between oil prices and the US Dollar there’s perhaps a more dominant factor at play with tensions in the Middle East.
For the levels – that DXY breakout test is taking place right now, and I’ve included the correlation coefficient between oil prices and the DXY basket on the lower part of the chart.
US Dollar Daily Chart – Breakout Test and Correlation with Oil Futures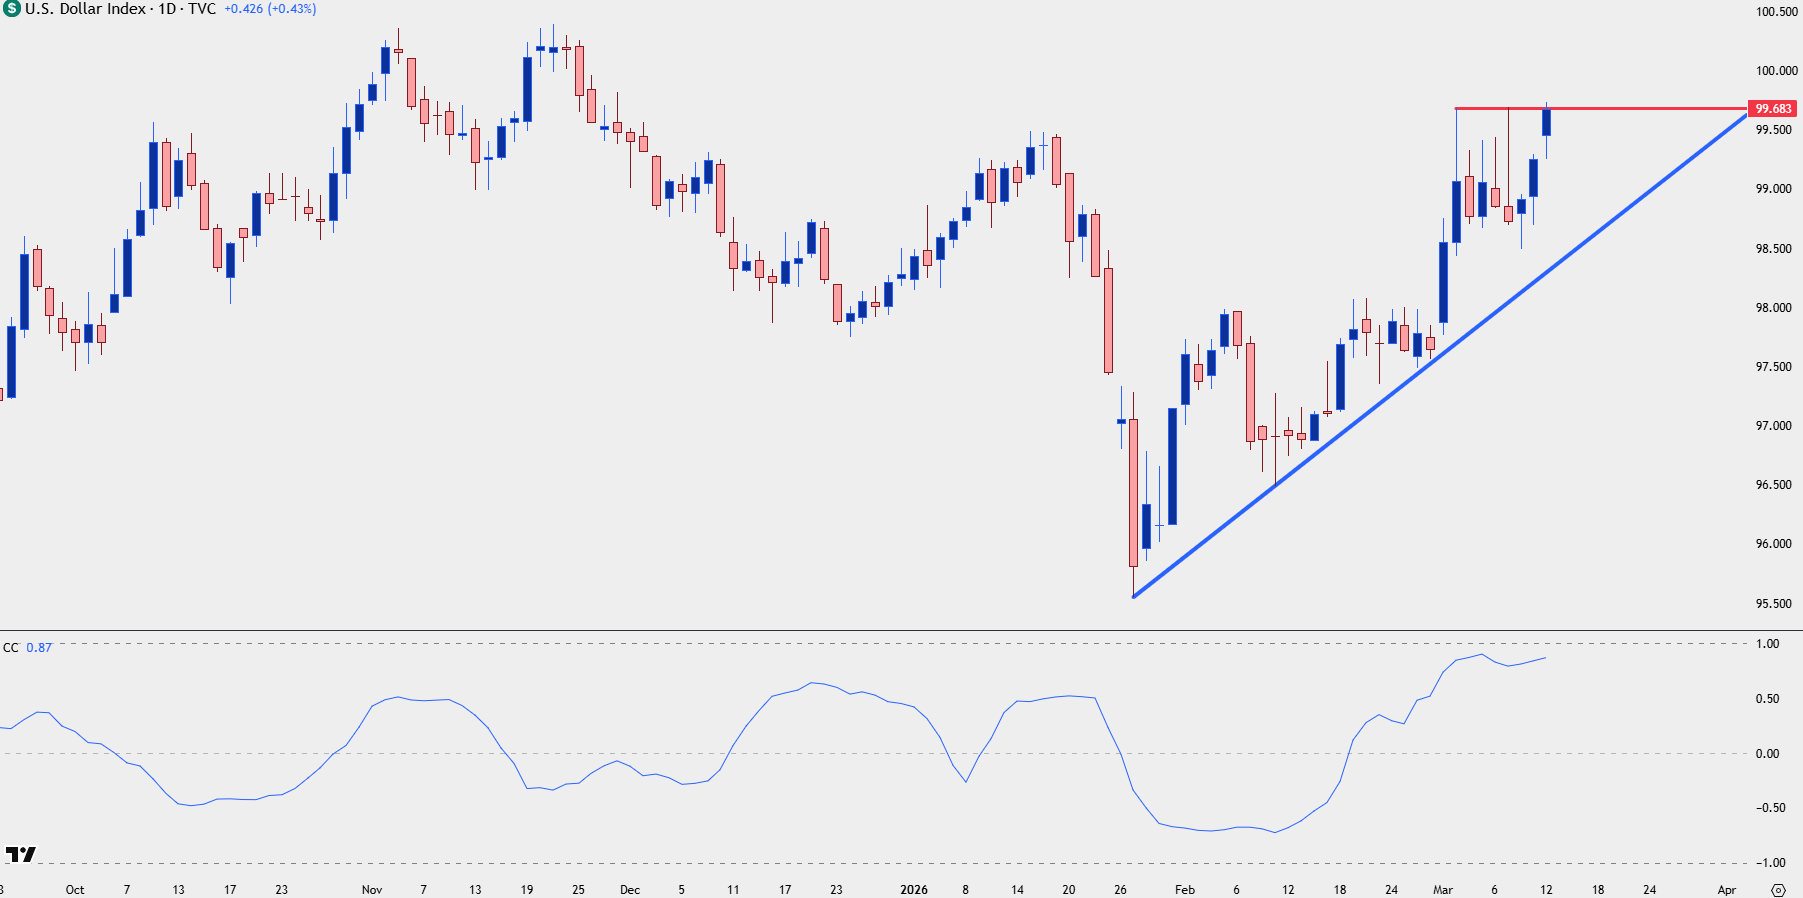
Chart prepared by James Stanley; data derived from Tradingview
USD – Will One Liquidity Sweep Lead to Another?
The 98.73 level looked at in last week’s webinar initially held support quite well, allowing for another bounce and test of highs. But bulls failed to drive through the prior high of 99.68, and price reverted back to support earlier this week.
That 98.73 level was tested through albeit briefly, and the sell-off then stalled and this highlights a liquidity sweep event – when an obvious level of support or resistance is broken and when sitting orders, often stop orders, get executed, the move then stalls and goes back in the other direction.
The question now is whether the current breakout test in the USD leads to another similar type of event. And going along with that, are a couple of major pairs testing massive levels of their own. Combine that with the fact that there’s a big day of data tomorrow – and the fact that President Trump has been actively trying to work on the other side of this very correlated trade – and there’s wherewithal to look for pullback potential.
Since the above video was recorded, we’ve already seen DXY tip up to that fresh high and so far the move hasn’t’ been able to sustain.
US Dollar Hourly Chart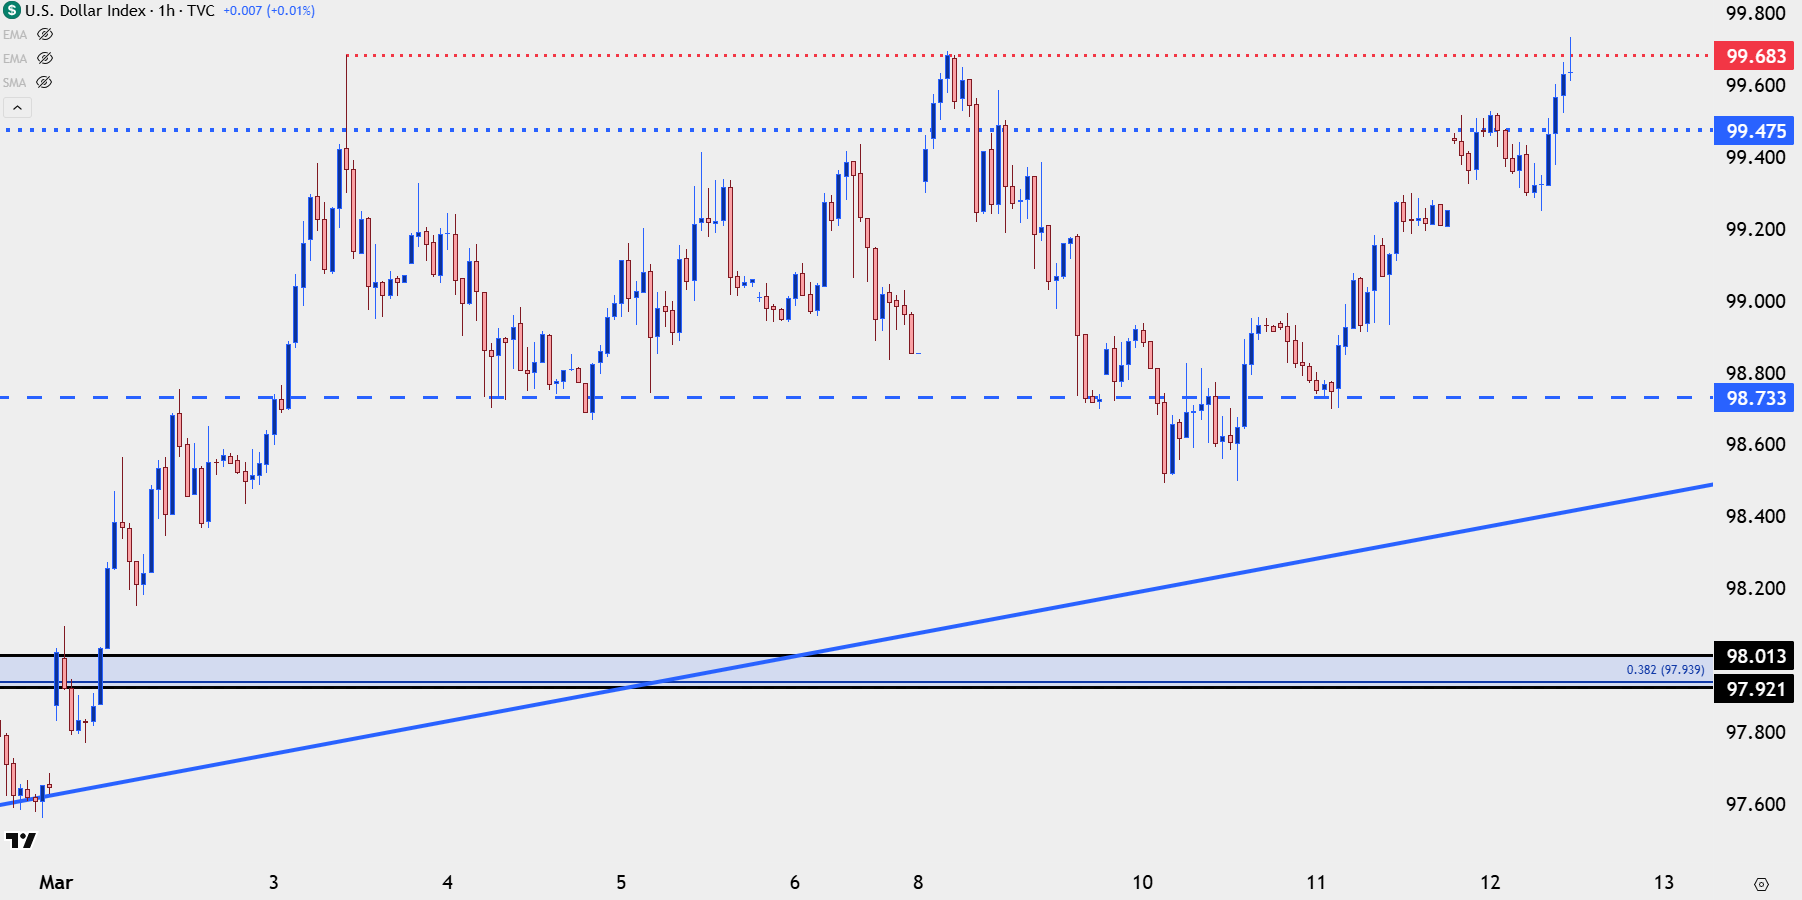
Chart prepared by James Stanley; data derived from Tradingview
EUR/USD
While DXY has been positively correlated with oil prices EUR/USD has been negatively correlated, which makes sense given that the USD is in the denominator of the quote.
Also of issue here is the 1.1500 level, which was last in-play back in November as it helped to set a higher-low before EUR/USD launched into the rally that eventually eclipsed the 1.2000 level. But now – sellers are stretching after they shied away from a test there, holding the low just 7.3 pips above the big figure as we saw the gap-up in oil and down in stocks to start this week.
EUR/USD Daily Chart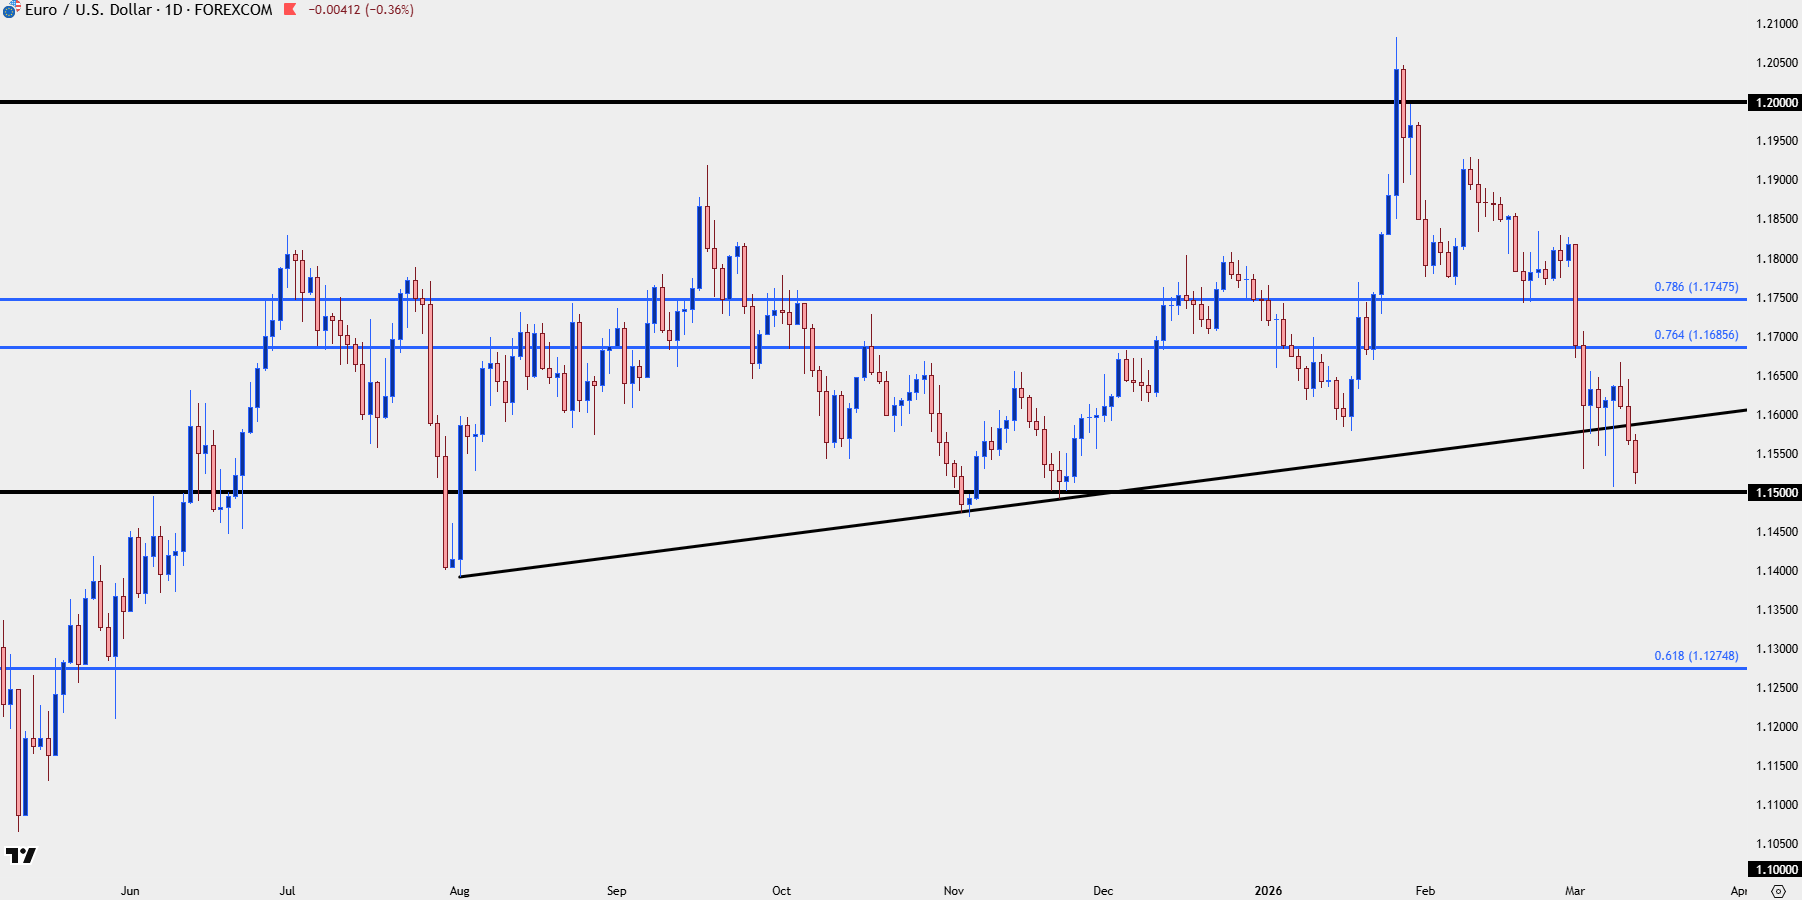
Chart prepared by James Stanley; data derived from Tradingview
USD/JPY
USD/JPY is also near a major spot of resistance as price is edging towards a re-test of the yearly high; and it’s the 160.00 level above that which really looms large as this is the spot that bulls have continually failed to drive above for the past few years.
For that 160 level to get taken out, it would seem that we would probably need to see a notable breakout in oil which would come along with a breakdown in stocks. This would also be something that both the US Treasury and the Japanese Finance Ministry would probably not want to see, along with the fact that President Trump is probably going to try to assuage concerns around the war – and oil prices (and in turn stock prices) – as we go into the weekend.
USD/JPY Weekly Price Chart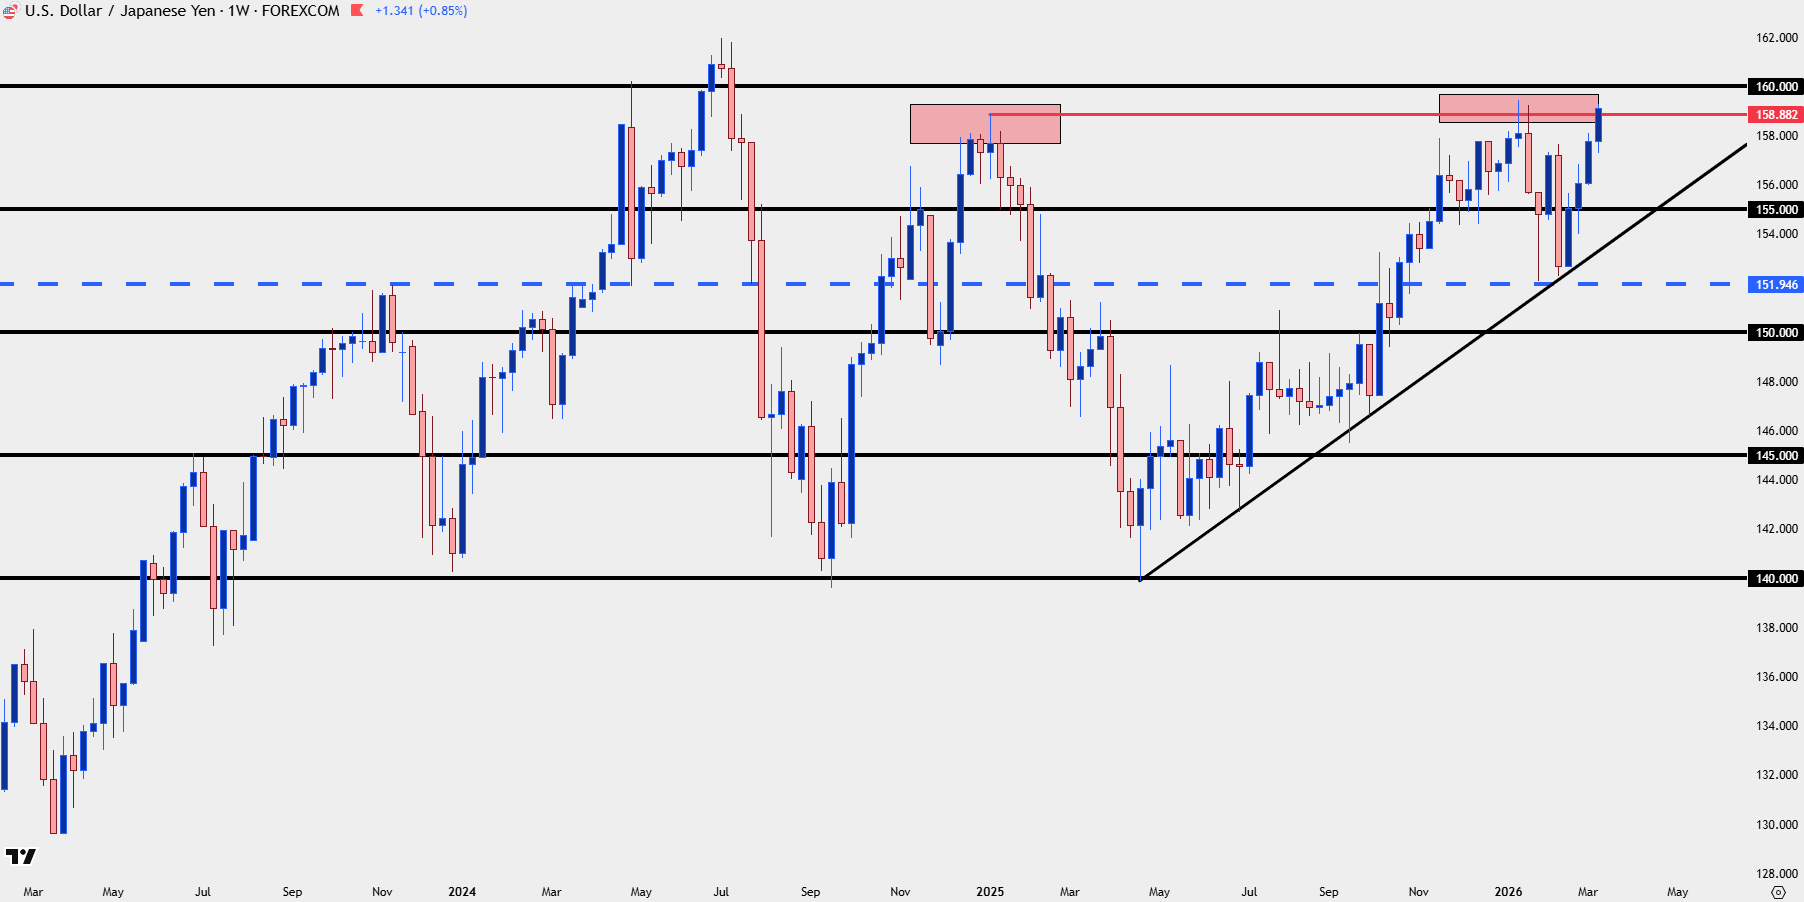
Chart prepared by James Stanley; data derived from Tradingview
--- written by James Stanley, Senior Market Analyst, Global Macro