
Key support levels are in focus this week as the US dollar and Treasury yields pull back, crude oil prices rise, and markets prepare for major tech earnings and central-bank decisions next week.
The week opened with a pullback in crude oil prices amid lower oil-demand growth expectations and reports that President Trump may waive sanctions on Russia. However, bullish risks remain on the crude oil charts, limiting risk appetite as disruptions around the Strait of Hormuz persist. The approach of major elections in Israel and the United States may also influence the geopolitical outlook in the coming weeks.
Key Support Levels I’m Watching
-
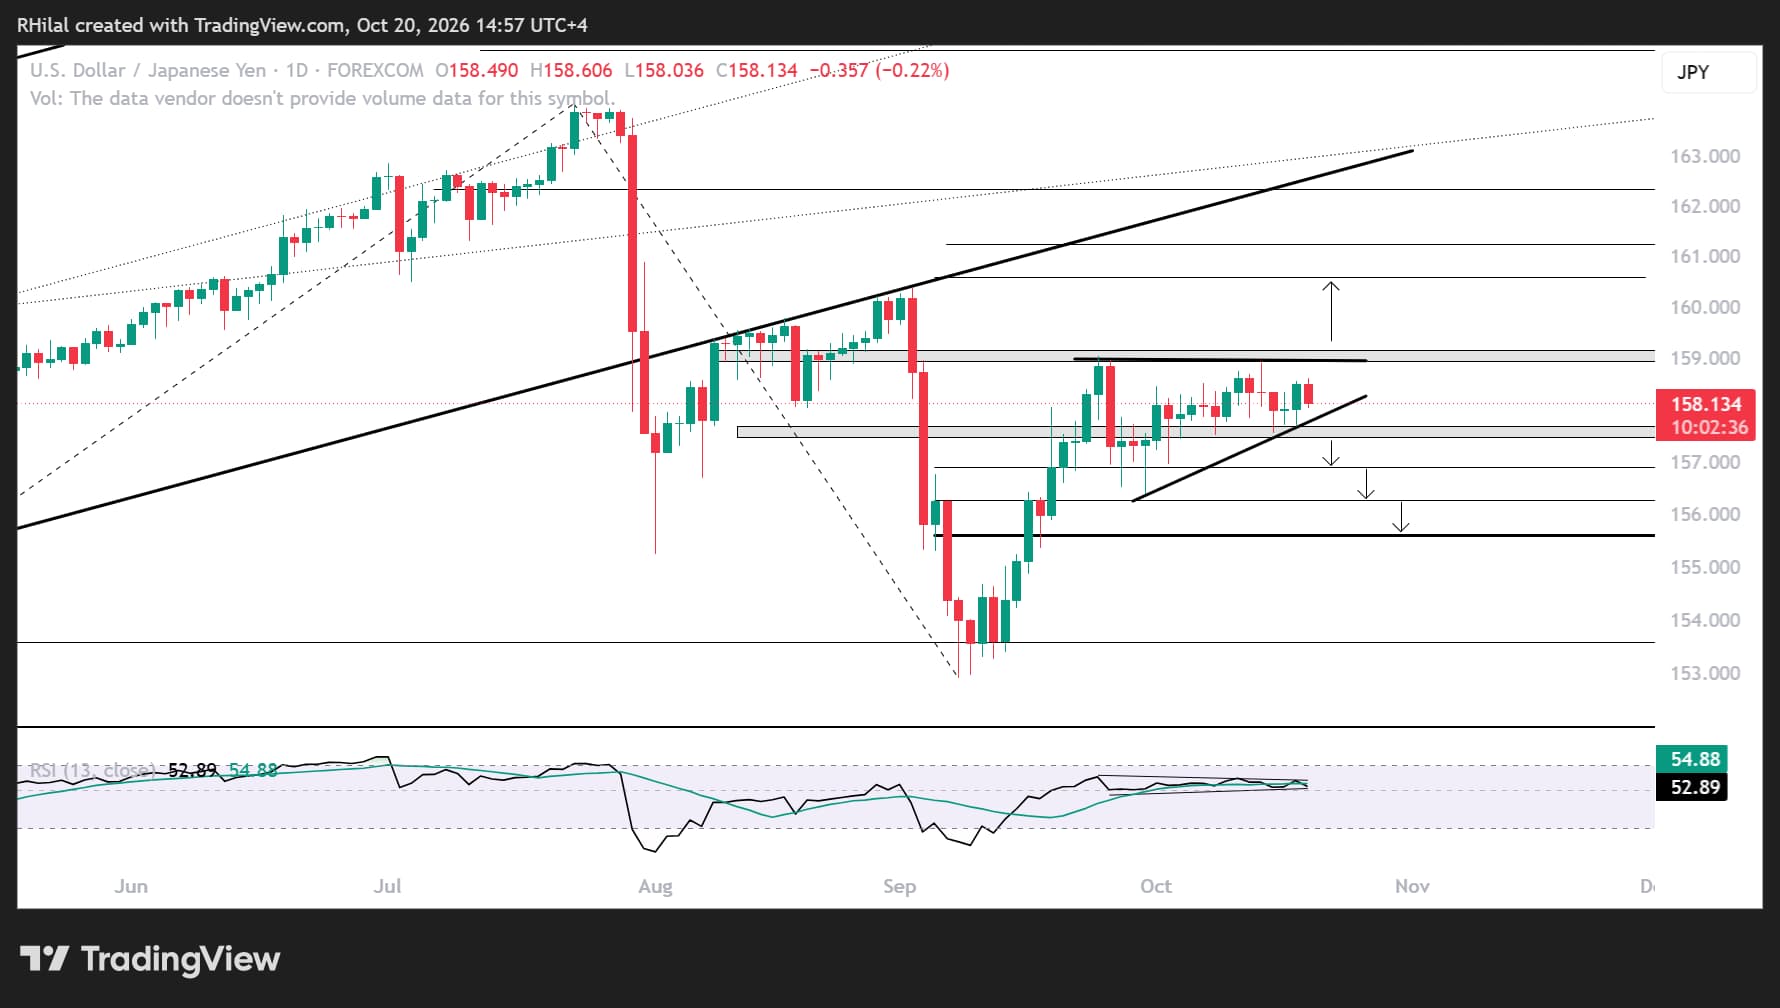
USD/JPY: 157.40
-
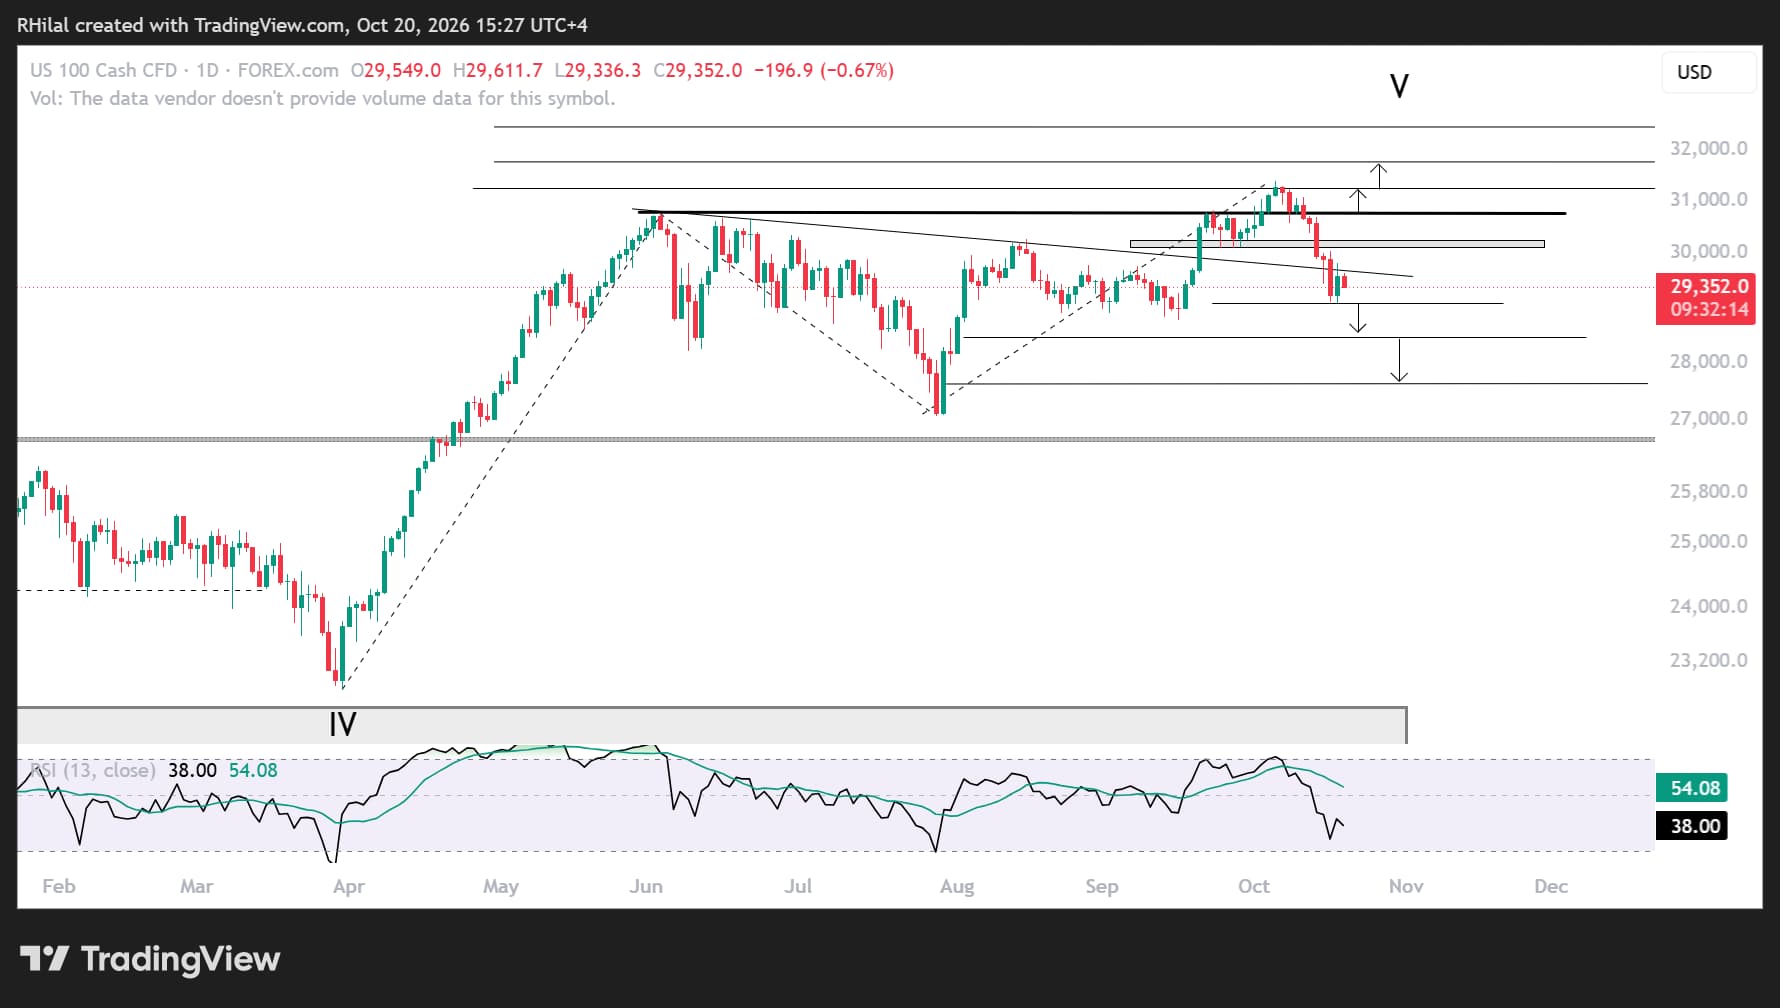
Nasdaq: 29,000
-
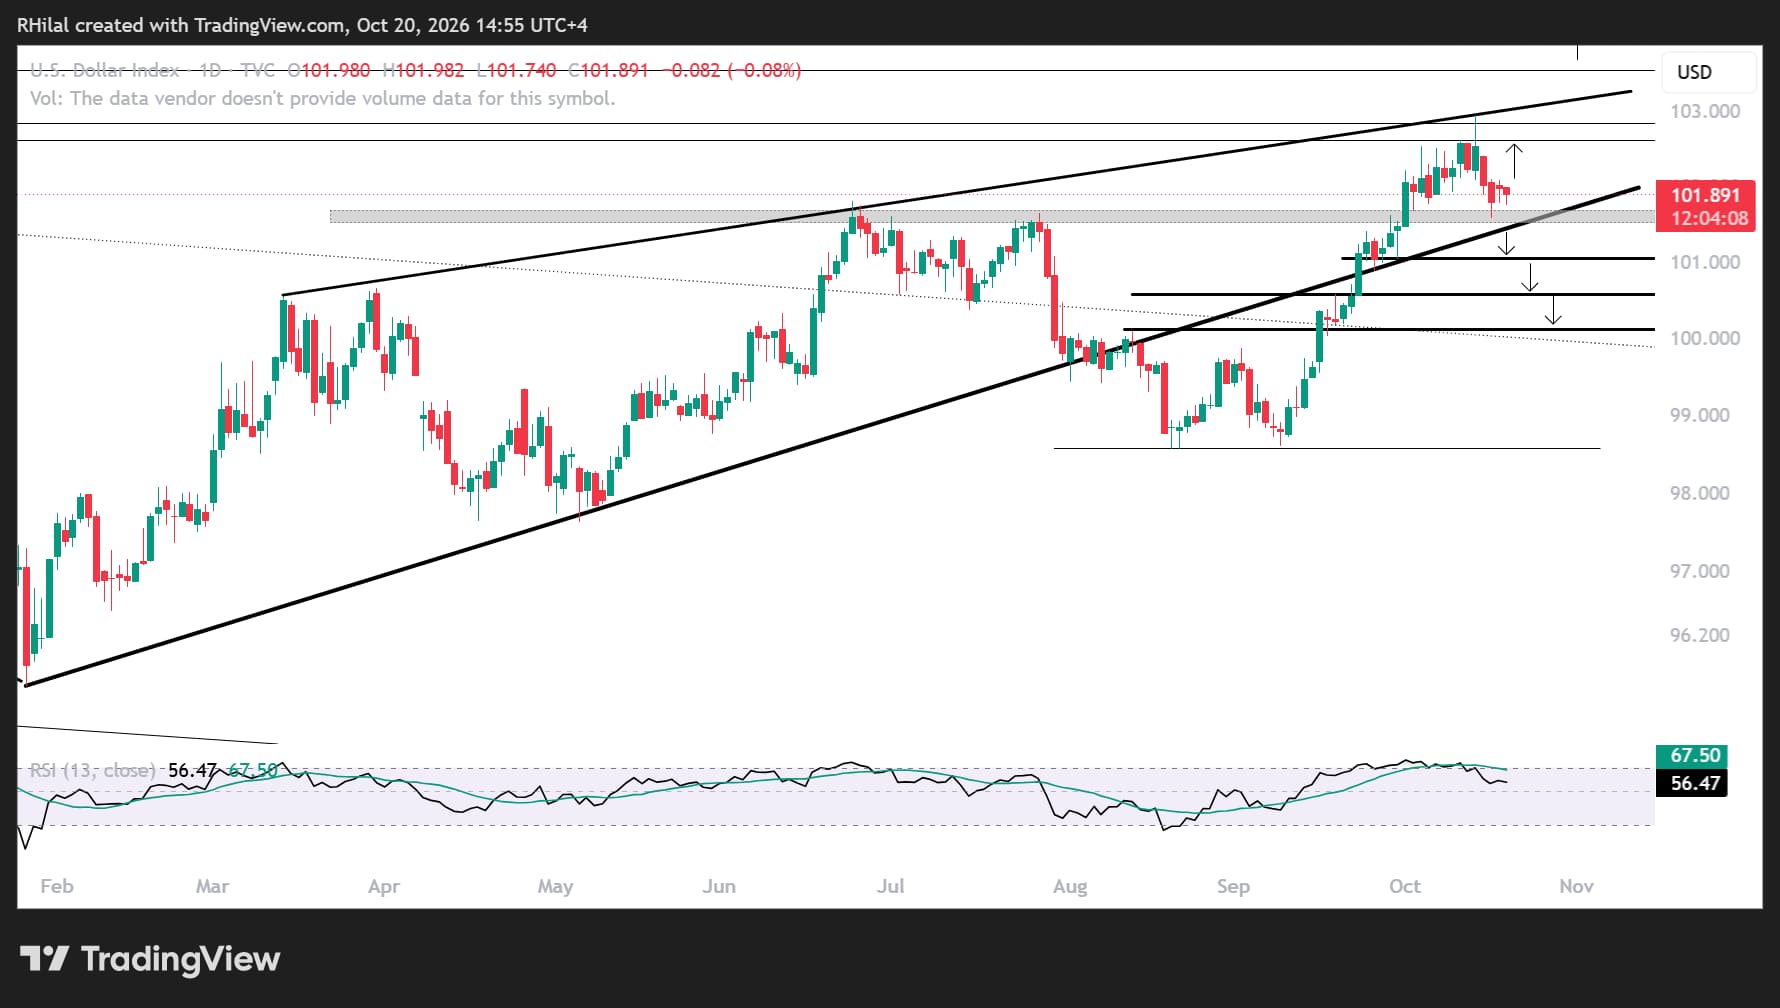
DXY: 101.50
-
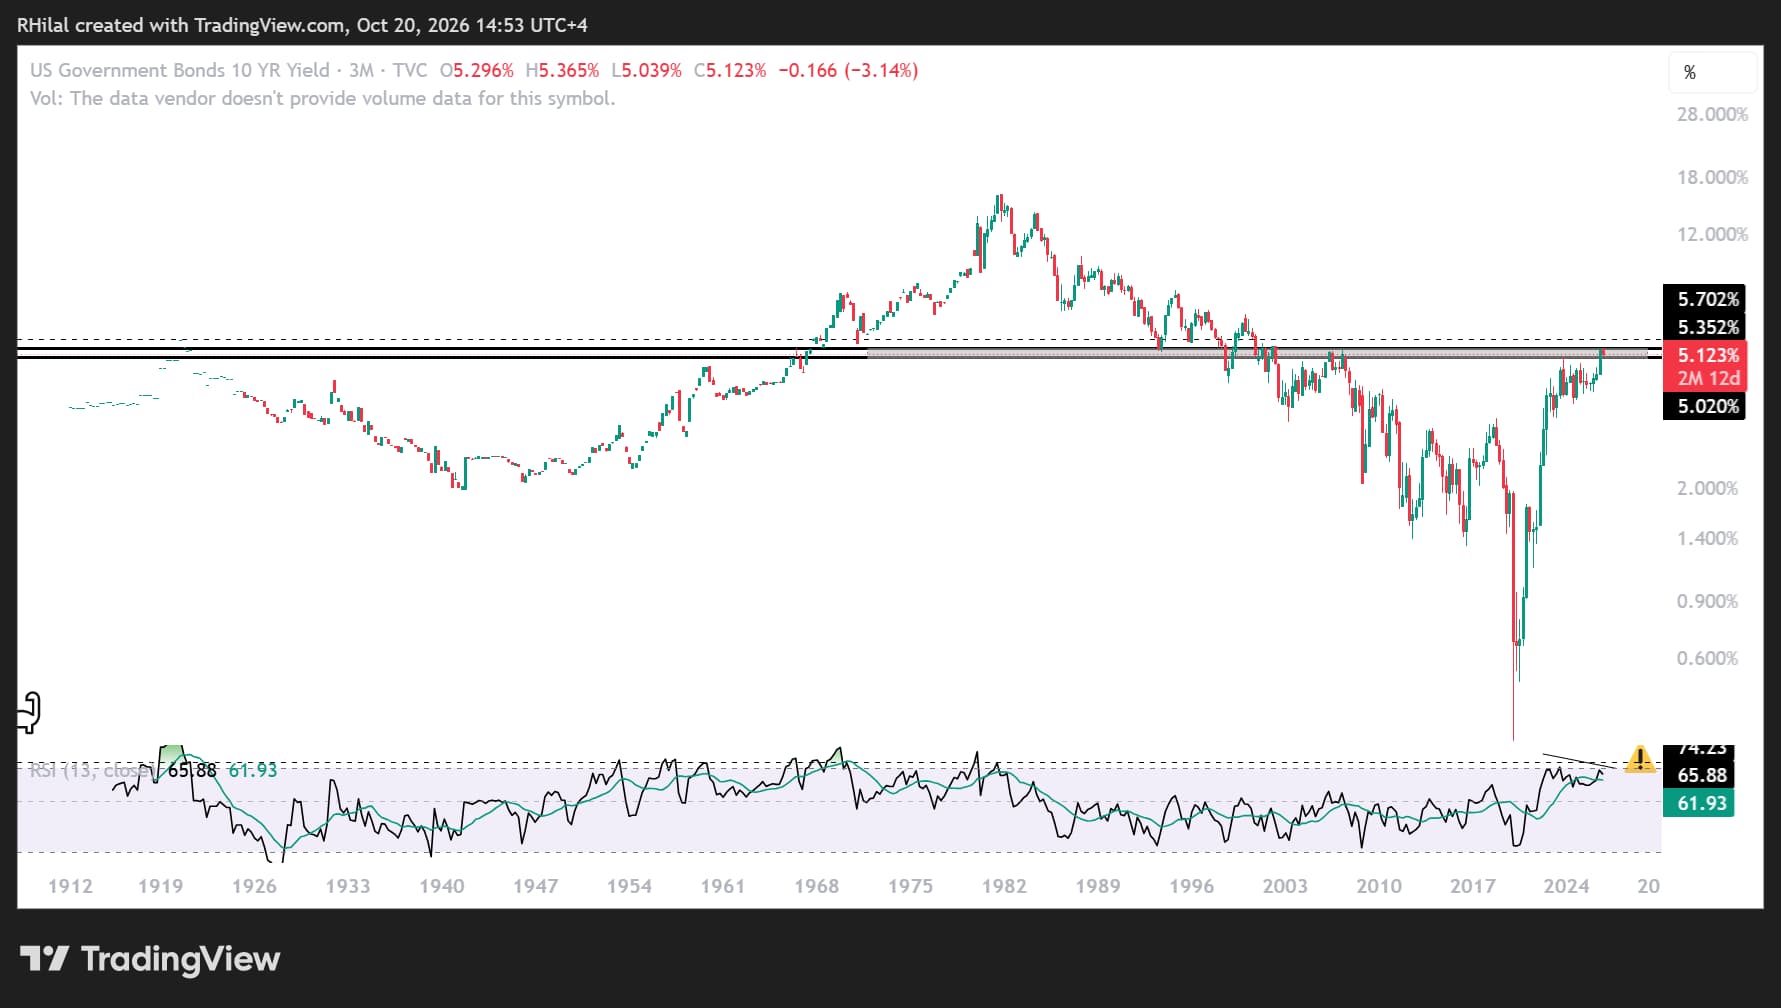
US 10-year yield: 5%
US 10-Year Treasury Yield Outlook: Three-Month Time Frame – Log Scale
Source: TradingView
The latest pullback in US 10-year Treasury yields comes as the yield tests a historically significant resistance barrier dating back to the 1920s. Bearish-divergence risks have also emerged as momentum retreats from overbought levels last seen in 2022 and 1980. Together, these signals raise the possibility of a longer-term decline in yields, which could help set the stage for a sustained market uptrend.
The yield is currently testing support near 5%, while inflation concerns persist. A break below this level could support risk appetite. By contrast, a move above 5.34% could put pressure on markets and expose charts to fresh 2026 lows.
I cover these charts in my weekly webinars
DXY Outlook: Three-Month Time Frame – Log Scale
Source: TradingView
The DXY has pulled back from the psychological 103 level, which aligns with eight-month rising resistance. The retreat also follows daily overbought momentum conditions last seen in 2023. The index is now testing a key support zone between 101.50 and 101, based on both price action and RSI.
A break below this zone could deepen the DXY’s decline, potentially in line with rate-hold expectations and a geopolitical de-escalation scenario. On the upside, a move back above 102.60 and 103 would shift focus toward renewed upside risks.
USD/JPY Outlook: Daily Time Frame – Log Scale
Source: TradingView
USD/JPY has been consolidating within a sideways triangle for nearly a month, below resistance at 159. The pattern may be forming an ascending triangle. A breakout above 159 could open the way for another rally toward 160.60 and 161.20.
This scenario would likely align with a bullish breakout in the dollar above 103, renewed geopolitical tensions and hawkish Fed risks.
Nasdaq Outlook: Daily Time Frame – Log Scale
Source: TradingView
With SpaceX and Netflix reporting today, followed by Meta and Tesla tomorrow, the Nasdaq is holding above support near 29,000. Daily RSI is rebounding from oversold conditions last seen in August and March, raising the potential for a bullish reversal.
A breakout above 29,800, followed by 30,100 and 30,300, would reinforce the longer-term bullish outlook. On the downside, a break below 29,000—which aligns with the 61.8% extension of the June–July–October wave—would expose 28,400, 27,600 and 26,600, respectively, before another potential dip-buying opportunity emerges.
Written by Razan Hilal, CMT
Follow on X: @Rh_waves