As the first week of December comes to an end, the cryptocurrency market has begun to show a sense of indecision in recent price movements. Despite some recovery throughout the week, major cryptocurrencies failed to close in positive territory and instead posted moderate declines, suggesting that a persistent neutrality has started to take shape in short-term market behavior. It is important to remember that during the last week of November, the crypto market experienced a notable rebound, but this week’s performance has revived concerns that such optimism may have been temporary, reopening the possibility of a renewed period of selling pressure, as has dominated the market over the past two months.

Performance of Major Cryptocurrencies
Source: Data - StoneX, Tradingview
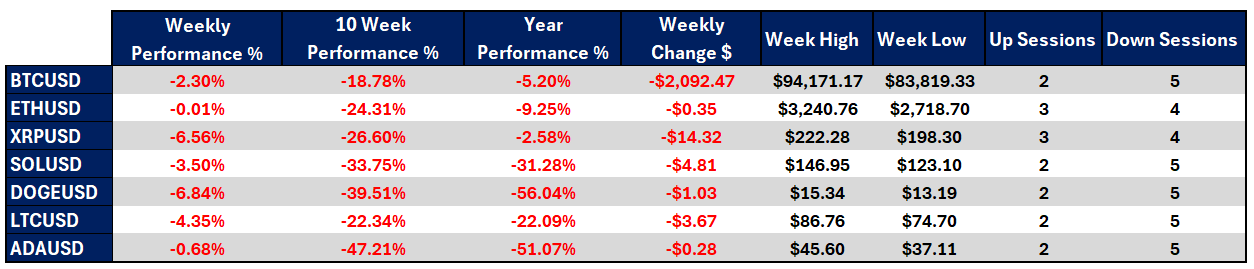
- The cryptocurrency with the smallest decline during the past week was Ethereum, falling only -0.01% over the last seven sessions. In contrast, Dogecoin once again experienced pronounced bearish pressure, ending the week with a -6.84% loss.
- Over the past ten weeks, the late-November rebound has not been enough to reverse the market’s generally negative performance. Cardano remains one of the most heavily affected assets, showing a -47.21% decrease, while Bitcoin has been comparatively more resilient, accumulating a smaller—though still notable—loss of -18.78%.
- On a year-to-date basis, all major cryptocurrencies are on track to end 2025 in negative territory. Ripple is the least affected, with a decline of just -2.58%, while Dogecoin remains the most impacted, posting a -56.04% annual loss.
- Bitcoin itself reflects this indecision, with prices fluctuating between 80,000 USD and 90,000 USD during the week.
- Overall, the constant mix of rebounds and declines across major cryptocurrencies highlights that neutrality continues to dominate short-term market conditions.
Red = negative correlation | Green = positive correlation
Source: Data - StoneX, Tradingview
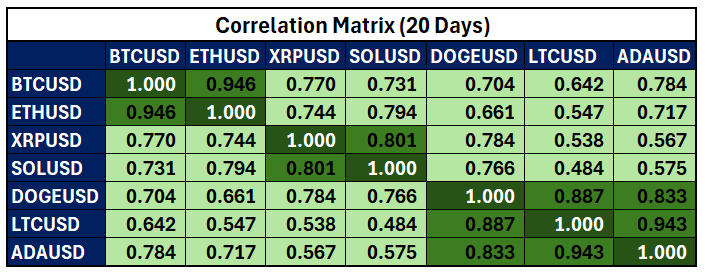
As indecision has intensified, major cryptoassets have begun to lose correlation with Bitcoin. Currently, only Ethereum maintains a high correlation coefficient above 0.9, while most other cryptocurrencies hover around 0.7, still positive but lower than in previous weeks. This shift indicates that prolonged indecision has reduced the similarity of movements between major altcoins and Bitcoin, suggesting the absence of any dominant market bias—bullish or bearish—for the crypto market as a whole. Correlation coefficients may vary over time.
If correlations continue diverging from their prior levels while mild market devaluation persists, a sustained neutral sentiment may take hold over the next several sessions.
Bitcoin Fails to Break Its Downtrend
Source: StoneX, Tradingview
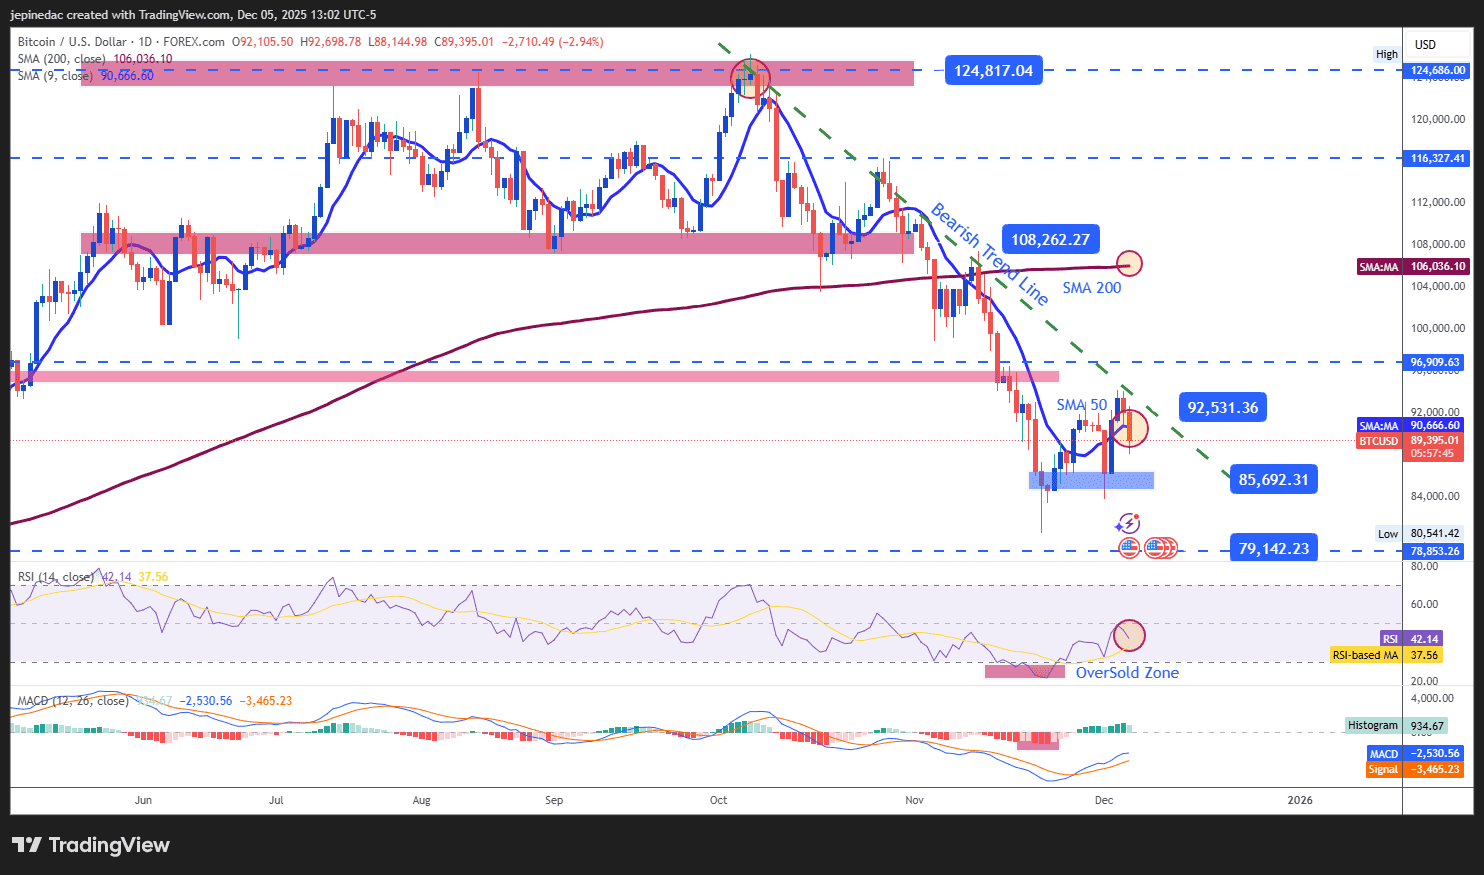
The average price behavior throughout the week has been highly indecisive for Bitcoin. Mid-week, BTC appeared to be forming a consistent recovery, but toward the end of the week, the prevailing bearish bias once again took control, maintaining the long-standing downtrend line established from the highs above 120,000 USD.
Unless buying pressure strengthens meaningfully, it is likely that this downtrend will continue dominating the chart into year-end.
Indicators:
- Although the MACD and RSI had attempted to show a recovery above their neutral zones, both indicators have recently begun to turn downward again: the RSI shows a negative slope pulling away from the neutral 50 level, while the MACD histogram displays a decline, indicating weakening short-term buying strength. Together, these behaviors suggest that a renewed bearish bias has begun to develop in BTC. If this downward trajectory persists, it could result in more consistent selling pressure in the upcoming sessions.
Key Levels:
- 92,500 USD – Key Resistance: This level corresponds to a major neutrality zone observed in May and aligns with the downtrend line. A sustained break above it would challenge the prevailing bearish structure and could allow for a more relevant bullish bias.
- 85,692 USD – Nearby Barrier: This level coincides with recent lows. If the price approaches this area weakly, it may reinforce a period of indecision, favoring the formation of a short-term sideways range.
- 79,000 USD – Final Support: This marks the annual lows. A break below this area would trigger more aggressive selling and solidify a deeper bearish trend heading into the end of the year.
Ethereum Shows the Greatest Stability
Source: StoneX, Tradingview
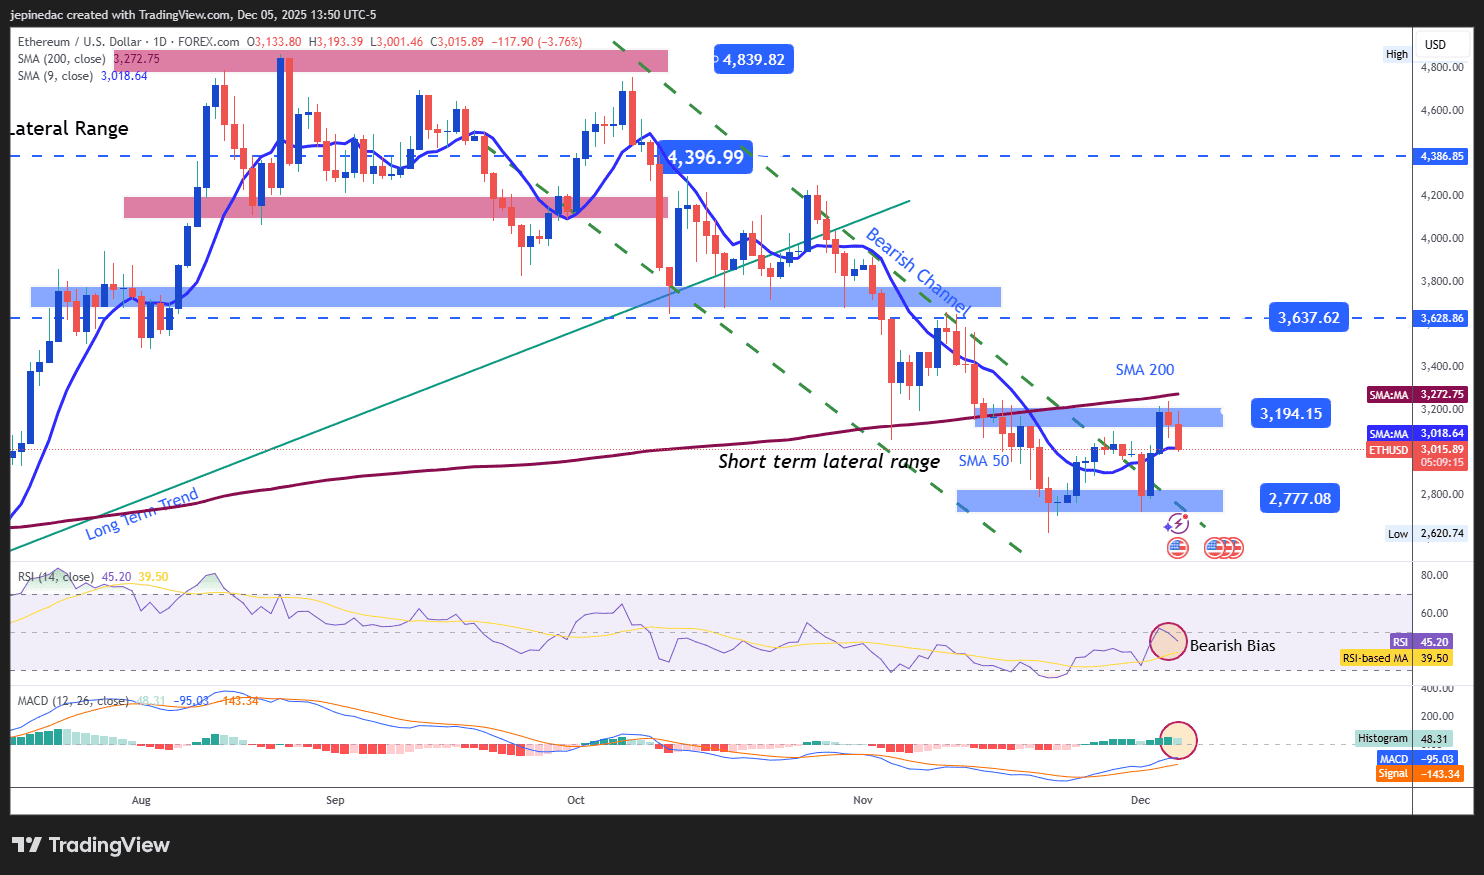
Ethereum has stood out in recent sessions as nearly the only cryptocurrency maintaining a neutral performance. Unlike other major assets, Ether has managed to break free from the recent bearish channel and now trades within a potential short-term sideways range between 3,200 USD (ceiling) and 2,800 USD (floor).
As long as price remains within this range, neutrality may continue to dominate short-term movement.
Indicators:
- Both the RSI and MACD remain near their neutral regions, indicating a neutral bias in short-term momentum and moving-average strength. If this pattern continues, indecision may continue shaping Ether’s price behavior in the coming sessions.
Key Levels:
- 3,600 USD – Key Resistance: This is an important neutrality zone observed since July and aligns with the 200-period moving average. A sustained breakout above this level could activate a new dominant bullish bias.
- 3,200 USD – Nearby Barrier: This level marks the upper limit of the potential short-term range and aligns with the 200-period simple moving average. A break above it could lead to more consistent bullish movement.
- 2,800 USD – Final Support: This level represents the lows of the recent bearish channel. A break below it would end the current lateral range and could reactivate the broader bearish channel previously in place.
Written by Julian Pineda, CFA, CMT – Market Analyst
Follow him at: @julianpineda25