



AUDUSD bullish technical event on the CCI
The pair continues to trade towards a major top: Chart
Share this:

The US Dollar was bearish against most of its major pairs on Wednesday with the exception of the NZD, GBP and JPY. On the US economic data front, the Mortgage Bankers Association's Mortgage Applications slipped 0.6% for the week ending November 27th, compared to +3.9% in the previous week. Automatic Data Processing's Employment Change showed that 307K jobs were added on month in November (440K expected), compared to a revised 404K jobs added in October. Finally, the Federal Reserve's Beige Book stated that most Districts described economic expansion as moderate since the last reporting period. Nearly all Districts reported that employment rose, but for most, at a slow pace and that a full recovery is still incomplete. In most Districts, companies disclosed that input prices rose modestly, along with selling prices of final goods. However, the rise in Covid-19 cases has brought about more school and plant closures as well as renewed fears of infection.
On Thursday, Initial Jobless Claims for the week ending November 28th are expected to decline to 775K, from 778K in the week before. Finally, Continuing Claims for the week ending November 21st are expected to fall to 5,800K, from 6,071K in the prior week.
The Euro was bullish against most of its major pairs with the exception of the AUD and CHF. In Europe, the German Federal Statistical Office has released October retail sales at +2.6% (vs +1.2% on month expected). Also, the European Commission has posted October PPI at +0.4% (vs +0.2% on month expected) and jobless rate at 8.4%, as expected.
The Australian dollar was bullish against all of its major pairs. The AUD/USD gained 39 pips on Wednesday as the pair extends its uptrend towards key resistance at 0.742. A break above 0.742 would be a strong bullish signal. Using the "technical Insight" research tool under the Market Analysis tab, a short-term bullish signal has been identified in the Commodity Channel Index (CCI) indicating a relatively far deviation from the pair's 20-day average price.
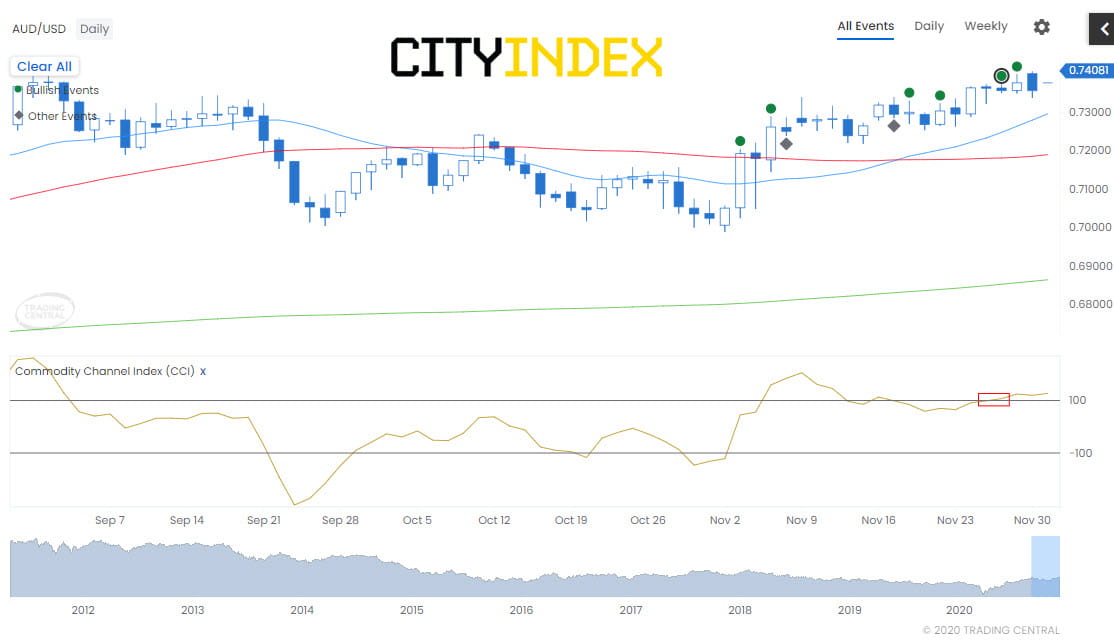
Source: GAIN Capital, Technical Insight
The Commodity Channel Index (CCI) measures the deviation of the price from its average value (comparing to a chosen moving average, typically 20 bars). The oscillator is normalized by dividing by the typical deviation, so we get an oscillator fluctuating roughly between +100 and -100. Many traders use these as overbought(+100)/oversold(-100) markers and watch for signs of reversal, but original use was to consider long positions when CCI is above +100 (bullish event), and short when below -100 (bearish event). When the price crosses back in between +100 and -100, another event is triggered to indicate an end to the prior bullish or bearish situation and a possible opportunity to close out such a position.
On Thursday, Initial Jobless Claims for the week ending November 28th are expected to decline to 775K, from 778K in the week before. Finally, Continuing Claims for the week ending November 21st are expected to fall to 5,800K, from 6,071K in the prior week.
The Euro was bullish against most of its major pairs with the exception of the AUD and CHF. In Europe, the German Federal Statistical Office has released October retail sales at +2.6% (vs +1.2% on month expected). Also, the European Commission has posted October PPI at +0.4% (vs +0.2% on month expected) and jobless rate at 8.4%, as expected.
The Australian dollar was bullish against all of its major pairs. The AUD/USD gained 39 pips on Wednesday as the pair extends its uptrend towards key resistance at 0.742. A break above 0.742 would be a strong bullish signal. Using the "technical Insight" research tool under the Market Analysis tab, a short-term bullish signal has been identified in the Commodity Channel Index (CCI) indicating a relatively far deviation from the pair's 20-day average price.
Source: GAIN Capital, Technical Insight
The Commodity Channel Index (CCI) measures the deviation of the price from its average value (comparing to a chosen moving average, typically 20 bars). The oscillator is normalized by dividing by the typical deviation, so we get an oscillator fluctuating roughly between +100 and -100. Many traders use these as overbought(+100)/oversold(-100) markers and watch for signs of reversal, but original use was to consider long positions when CCI is above +100 (bullish event), and short when below -100 (bearish event). When the price crosses back in between +100 and -100, another event is triggered to indicate an end to the prior bullish or bearish situation and a possible opportunity to close out such a position.
The US Dollar was bearish against most of its major pairs on Wednesday with the exception of the NZD, GBP and JPY. On the US economic data front, the Mortgage Bankers Association's Mortgage Applications slipped 0.6% for the week ending November 27th, compared to +3.9% in the previous week. Automatic Data Processing's Employment Change showed that 307K jobs were added on month in November (440K expected), compared to a revised 404K jobs added in October. Finally, the Federal Reserve's Beige Book stated that most Districts described economic expansion as moderate since the last reporting period. Nearly all Districts reported that employment rose, but for most, at a slow pace and that a full recovery is still incomplete. In most Districts, companies disclosed that input prices rose modestly, along with selling prices of final goods. However, the rise in Covid-19 cases has brought about more school and plant closures as well as renewed fears of infection.
On Thursday, Initial Jobless Claims for the week ending November 28th are expected to decline to 775K, from 778K in the week before. Finally, Continuing Claims for the week ending November 21st are expected to fall to 5,800K, from 6,071K in the prior week.
The Euro was bullish against most of its major pairs with the exception of the AUD and CHF. In Europe, the German Federal Statistical Office has released October retail sales at +2.6% (vs +1.2% on month expected). Also, the European Commission has posted October PPI at +0.4% (vs +0.2% on month expected) and jobless rate at 8.4%, as expected.
The Australian dollar was bullish against all of its major pairs. The AUD/USD gained 39 pips on Wednesday as the pair extends its uptrend towards key resistance at 0.742. A break above 0.742 would be a strong bullish signal. Using the "technical Insight" research tool under the Market Analysis tab, a short-term bullish signal has been identified in the Commodity Channel Index (CCI) indicating a relatively far deviation from the pair's 20-day average price.

Source: GAIN Capital, Technical Insight
The Commodity Channel Index (CCI) measures the deviation of the price from its average value (comparing to a chosen moving average, typically 20 bars). The oscillator is normalized by dividing by the typical deviation, so we get an oscillator fluctuating roughly between +100 and -100. Many traders use these as overbought(+100)/oversold(-100) markers and watch for signs of reversal, but original use was to consider long positions when CCI is above +100 (bullish event), and short when below -100 (bearish event). When the price crosses back in between +100 and -100, another event is triggered to indicate an end to the prior bullish or bearish situation and a possible opportunity to close out such a position.
On Thursday, Initial Jobless Claims for the week ending November 28th are expected to decline to 775K, from 778K in the week before. Finally, Continuing Claims for the week ending November 21st are expected to fall to 5,800K, from 6,071K in the prior week.
The Euro was bullish against most of its major pairs with the exception of the AUD and CHF. In Europe, the German Federal Statistical Office has released October retail sales at +2.6% (vs +1.2% on month expected). Also, the European Commission has posted October PPI at +0.4% (vs +0.2% on month expected) and jobless rate at 8.4%, as expected.
The Australian dollar was bullish against all of its major pairs. The AUD/USD gained 39 pips on Wednesday as the pair extends its uptrend towards key resistance at 0.742. A break above 0.742 would be a strong bullish signal. Using the "technical Insight" research tool under the Market Analysis tab, a short-term bullish signal has been identified in the Commodity Channel Index (CCI) indicating a relatively far deviation from the pair's 20-day average price.
Source: GAIN Capital, Technical Insight
The Commodity Channel Index (CCI) measures the deviation of the price from its average value (comparing to a chosen moving average, typically 20 bars). The oscillator is normalized by dividing by the typical deviation, so we get an oscillator fluctuating roughly between +100 and -100. Many traders use these as overbought(+100)/oversold(-100) markers and watch for signs of reversal, but original use was to consider long positions when CCI is above +100 (bullish event), and short when below -100 (bearish event). When the price crosses back in between +100 and -100, another event is triggered to indicate an end to the prior bullish or bearish situation and a possible opportunity to close out such a position.



The complete CFD trading experience
Award-winning platforms, competitive spreads, low commissions and dedicated support.
We live and breathe the markets and are dedicated to helping traders realise their ambitions as we continue to set the industry bar.
Economic calendar
Web Trader platform
Our sophisticated web-based platform is packed with features.
Related articles

EUR/USD Q4 2026 Outlook: Euro at a Crossroads as Fed, ECB Tighten 9 25 2026
EUR/USD enters Q4 at a pivotal inflection point as competing Fed-ECB policy paths and persistent inflation risks collide with major technical support.


USD/JPY Q4 2026 Outlook: Hawkish Fed Pricing Clashes With Intervention Risk
The year-end tug-of-war is clear: hawkish Fed pricing supports USD/JPY, while intervention risk limits the upside.


Japanese Yen Forecast: USD/JPY 4% Rally Challenges Post-Intervention Downtrend 9 24 2026
USD/JPY momentum has shifted sharply higher, putting a major resistance confluence in focus as U.S. and Japanese event risk builds.
StoneX Europe Ltd may make third party material available on this website which may contain information included but not limited to the conditions of financial markets. The material is for information purposes only and does not contain, and should not be construed as containing, investment advice and/or investment recommendation and/or an investment research and/or an offer of or solicitation for any transactions in financial instruments; any decision to enter into a specific transaction shall be made by the client following an assessment by him/her of their situation.
StoneX Europe Ltd makes no representation or warranty and assumes no liability as to the accuracy or completeness of the information provided, nor any loss arising from any investment based on a recommendation, forecast or other information supplied. You should always seek independent advice as to your suitability to speculate in any related markets and your ability to assume the associated risks, if you are at all unsure. We are not under any obligation to update any such material. Any opinion made may be personal to the author and may not reflect the opinion of StoneX Europe Ltd.