



AUDUSD June 17
The Australian dollar remained under pressure against the U.S. dollar after losing 0.5% to close at $0.6887 overnight...
Share this:
Fears linger over a second wave of coronavirus pandemic in China.
Health authories of Beijing have traced over 100 new coronavirus cases to a large wholesale meat and produce market in the capital city. City authorities have raised Beijing's COVID-19 emergency response to Level 2 from Level 3. To halt a fresh outbreak, authorities have ordered all schools to close while imposing restrictions on visits to all residential compounds.
China is Australia's biggest trading partner. A potential drag on the Chinese economy by a second virus wave could also dent Australia's economic prospect.
Meanwhile, investors will watch closely Australia's official May jobs report due tomorrow (June 18). It is widely expected that the ecomomy reduced a further 78,800 jobs (594,3000 jobs cut in April) with the jobless rate climbing to 6.9% from 6.2%.
This morning, the Australian dollar remained under pressure against the U.S. dollar after losing 0.5% to close at $0.6887 overnight.
On an Intraday 30-minute Chart, AUD/USD has posted a Bearish Pattern of Lower Highs.

Source: GAIN Capital, TradingView
AUD/USD keeps trading at levels around the Lower Bollinger Band holding the intraday bias as bearish.
The level of 0.6900 (around the Upper Bollinger Band) is holding firmly as the Overhead Key Resistance.
A return to the Immediate Support at 0.6835 (around the intraday low of yesterday) would place the next line of support at 0.6795 (161.8% Fibonacci extrapolation from the key resistance) into sight.
Health authories of Beijing have traced over 100 new coronavirus cases to a large wholesale meat and produce market in the capital city. City authorities have raised Beijing's COVID-19 emergency response to Level 2 from Level 3. To halt a fresh outbreak, authorities have ordered all schools to close while imposing restrictions on visits to all residential compounds.
China is Australia's biggest trading partner. A potential drag on the Chinese economy by a second virus wave could also dent Australia's economic prospect.
Meanwhile, investors will watch closely Australia's official May jobs report due tomorrow (June 18). It is widely expected that the ecomomy reduced a further 78,800 jobs (594,3000 jobs cut in April) with the jobless rate climbing to 6.9% from 6.2%.
This morning, the Australian dollar remained under pressure against the U.S. dollar after losing 0.5% to close at $0.6887 overnight.
On an Intraday 30-minute Chart, AUD/USD has posted a Bearish Pattern of Lower Highs.
Source: GAIN Capital, TradingView
AUD/USD keeps trading at levels around the Lower Bollinger Band holding the intraday bias as bearish.
The level of 0.6900 (around the Upper Bollinger Band) is holding firmly as the Overhead Key Resistance.
A return to the Immediate Support at 0.6835 (around the intraday low of yesterday) would place the next line of support at 0.6795 (161.8% Fibonacci extrapolation from the key resistance) into sight.
Fears linger over a second wave of coronavirus pandemic in China.
Health authories of Beijing have traced over 100 new coronavirus cases to a large wholesale meat and produce market in the capital city. City authorities have raised Beijing's COVID-19 emergency response to Level 2 from Level 3. To halt a fresh outbreak, authorities have ordered all schools to close while imposing restrictions on visits to all residential compounds.
China is Australia's biggest trading partner. A potential drag on the Chinese economy by a second virus wave could also dent Australia's economic prospect.
Meanwhile, investors will watch closely Australia's official May jobs report due tomorrow (June 18). It is widely expected that the ecomomy reduced a further 78,800 jobs (594,3000 jobs cut in April) with the jobless rate climbing to 6.9% from 6.2%.
This morning, the Australian dollar remained under pressure against the U.S. dollar after losing 0.5% to close at $0.6887 overnight.
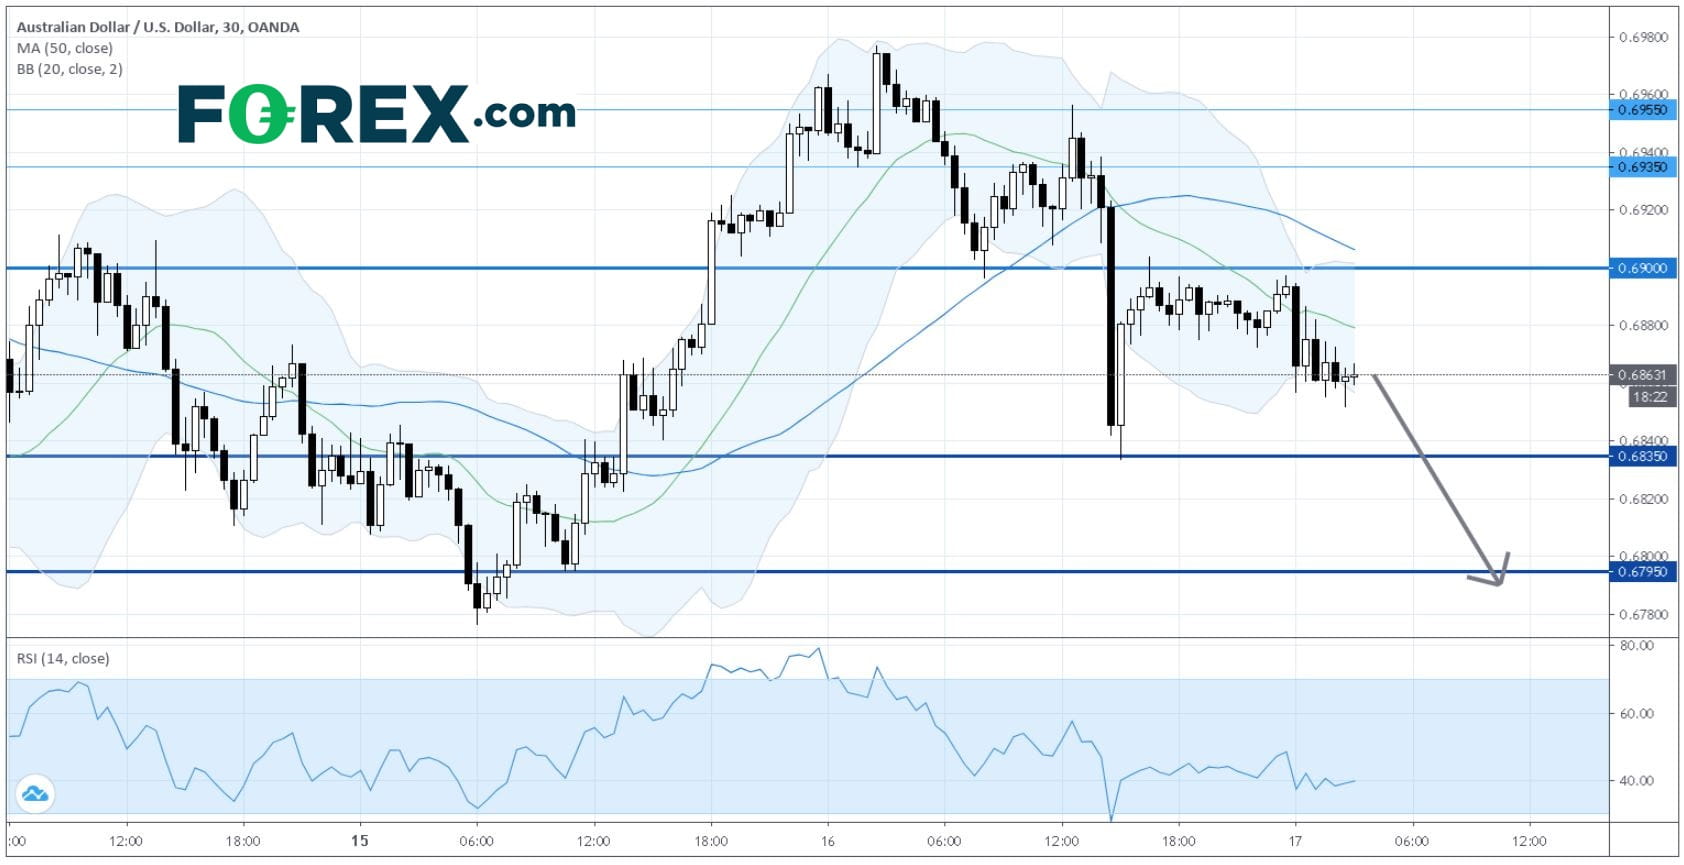
On an Intraday 30-minute Chart, AUD/USD has posted a Bearish Pattern of Lower Highs.
Source: GAIN Capital, TradingView
AUD/USD keeps trading at levels around the Lower Bollinger Band holding the intraday bias as bearish.
The level of 0.6900 (around the Upper Bollinger Band) is holding firmly as the Overhead Key Resistance.
A return to the Immediate Support at 0.6835 (around the intraday low of yesterday) would place the next line of support at 0.6795 (161.8% Fibonacci extrapolation from the key resistance) into sight.
Health authories of Beijing have traced over 100 new coronavirus cases to a large wholesale meat and produce market in the capital city. City authorities have raised Beijing's COVID-19 emergency response to Level 2 from Level 3. To halt a fresh outbreak, authorities have ordered all schools to close while imposing restrictions on visits to all residential compounds.
China is Australia's biggest trading partner. A potential drag on the Chinese economy by a second virus wave could also dent Australia's economic prospect.
Meanwhile, investors will watch closely Australia's official May jobs report due tomorrow (June 18). It is widely expected that the ecomomy reduced a further 78,800 jobs (594,3000 jobs cut in April) with the jobless rate climbing to 6.9% from 6.2%.
This morning, the Australian dollar remained under pressure against the U.S. dollar after losing 0.5% to close at $0.6887 overnight.
On an Intraday 30-minute Chart, AUD/USD has posted a Bearish Pattern of Lower Highs.
Source: GAIN Capital, TradingView
AUD/USD keeps trading at levels around the Lower Bollinger Band holding the intraday bias as bearish.
The level of 0.6900 (around the Upper Bollinger Band) is holding firmly as the Overhead Key Resistance.
A return to the Immediate Support at 0.6835 (around the intraday low of yesterday) would place the next line of support at 0.6795 (161.8% Fibonacci extrapolation from the key resistance) into sight.



The complete CFD trading experience
Award-winning platforms, competitive spreads, low commissions and dedicated support.
We live and breathe the markets and are dedicated to helping traders realise their ambitions as we continue to set the industry bar.
Economic calendar
Web Trader platform
Our sophisticated web-based platform is packed with features.
Related articles

EUR/USD Q4 2026 Outlook: Euro at a Crossroads as Fed, ECB Tighten 9 25 2026
EUR/USD enters Q4 at a pivotal inflection point as competing Fed-ECB policy paths and persistent inflation risks collide with major technical support.


USD/JPY Q4 2026 Outlook: Hawkish Fed Pricing Clashes With Intervention Risk
The year-end tug-of-war is clear: hawkish Fed pricing supports USD/JPY, while intervention risk limits the upside.


Japanese Yen Forecast: USD/JPY 4% Rally Challenges Post-Intervention Downtrend 9 24 2026
USD/JPY momentum has shifted sharply higher, putting a major resistance confluence in focus as U.S. and Japanese event risk builds.
StoneX Europe Ltd may make third party material available on this website which may contain information included but not limited to the conditions of financial markets. The material is for information purposes only and does not contain, and should not be construed as containing, investment advice and/or investment recommendation and/or an investment research and/or an offer of or solicitation for any transactions in financial instruments; any decision to enter into a specific transaction shall be made by the client following an assessment by him/her of their situation.
StoneX Europe Ltd makes no representation or warranty and assumes no liability as to the accuracy or completeness of the information provided, nor any loss arising from any investment based on a recommendation, forecast or other information supplied. You should always seek independent advice as to your suitability to speculate in any related markets and your ability to assume the associated risks, if you are at all unsure. We are not under any obligation to update any such material. Any opinion made may be personal to the author and may not reflect the opinion of StoneX Europe Ltd.