



AUD/USD, USD/JPY ASX 200 Analysis: Asian Open – 11th August 2023
The annual rate of US inflation rose expanded at a faster rate for the first month in 13 at 3.2% y/y, although it was beneath the 3.3% forecast. Prices also rose 0.2% as expected. The initial reaction was one of relief that inflation was not rising above expectations, with Wall Street rallying and the US dollar falling to help the likes of AUD/USD and EUR/USD rise momentarily after the release. But once the dust had settled and investors remembered that inflation still remains well above target, the US dollar regained its strength and Wall Street traded lower.
Share this:

Market Summary:
- The annual rate of US inflation rose expanded at a faster rate for the first month in 13 at 3.2% y/y, although it was beneath the 3.3% forecast. Prices also rose 0.2% as expected.
- The ‘basing effect’ is partly to blame here. As inflation peaked 12 months ago, the rate of change lower from the peak was relatively swift and that is now being phased out in recent data. But we have also seen commodity prices rising in recent weeks
- Core CPI expanded at it slowest pace in 21 months of 4.7%, and whilst it is moving in the correct direction is still remain elevated relative to the Fed’s 2% target. However, Powell’s preferred measure of core CPI less shelter was at 2.9%.
- The initial reaction was one of relief that inflation was not rising above expectations, with Wall Street rallying and the US dollar falling to help the likes of AUD/USD and EUR/USD rise momentarily after the release. But once the dust had settled and investors remembered that inflation still remains well above target, the US dollar regained its strength and Wall Street traded lower.
- Fed Fund futures now imply an 89% chance of a pause in September, up from 86% the day prior. Expectations for the Fed’s first cut are now implied as a 40% probability.
- Australian inflation expectations fell to 4.9% from 5.2%, according to the Westpac-Melbourne Institute survey
- Natural gas prices formed a bearish engulfing day at a key resistance level following an EIA report that supply had risen more than expected.

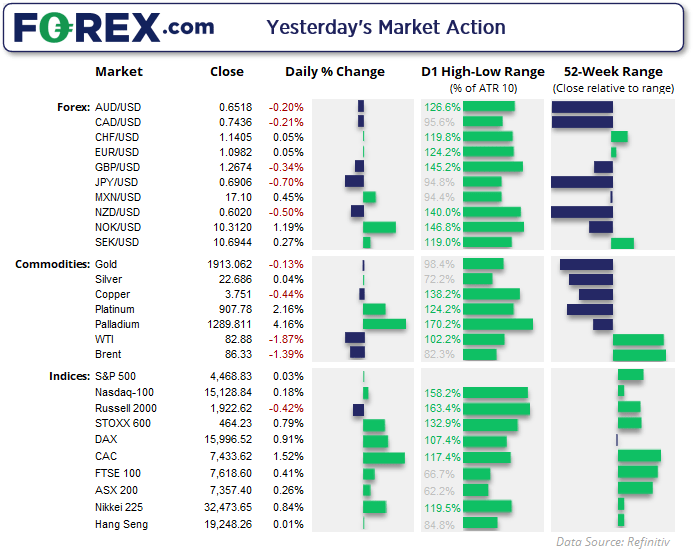
Events in focus (AEDT):
- 09:30 – RBA Assistant Governor Michelle Bullock Speaks: As the incoming Governor, her words may carry more market sway
- 09:50 – Japan’s retail sales
- 16:00 – UK GDP, construction output, manufacturing production, industrial production, trade balance: With traders having scaled back bets of a peak BOE rate above 6% and no appetite for 50bp hikes going forward, they’ll likely want to see weakness in today’s data dump to be sure that inflation really has peaked. Else GBP risks a bounce.
- 22:30 – US PPI: Whilst it doesn’t receive as much coverage as CPI data, softer producer prices are what we all want to see as it feeds back into a weaker consumer price narrative and peak rate for the Fed
ASX 200 at a glance:
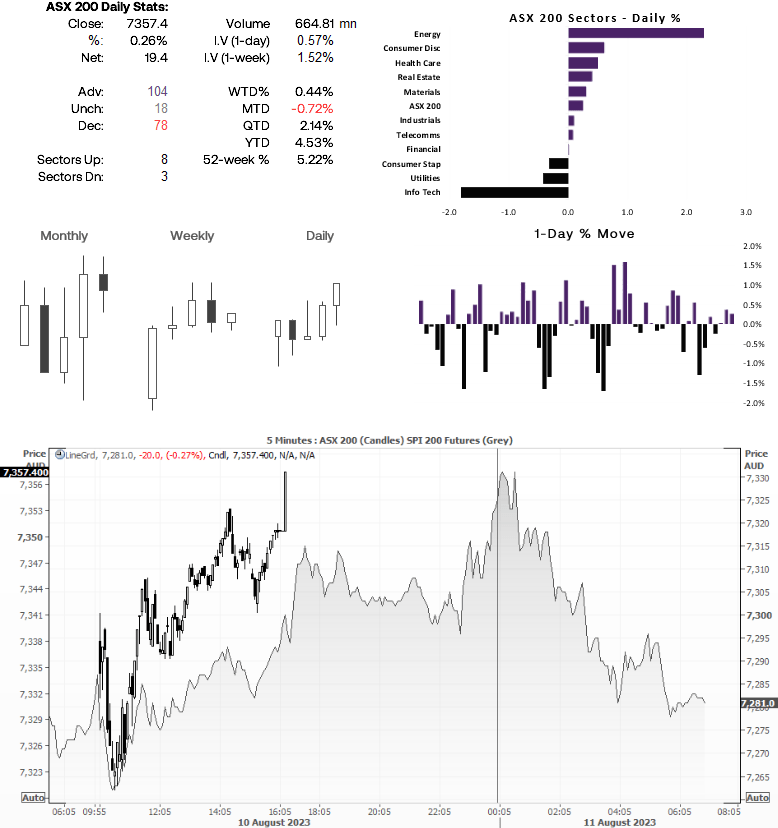
- The ASX 200 rose to a five day high and closed at the high of the day, making it a clean break from consolidation
- Yet Wall Street is lower and SPI futures point to a weaker open, so we may see prices trade back within its consolidation (assuming it cannot find support around the breakout level of 7324.5)
- If it can hold above the 7288 lows / 7300, then perhaps the ASX can dance to its own beat as it has a tendency to do.
- And any pullback within the range could be seen as an opportunity to increase the potential reward to risk ratio, for a move to the June / March highs around 7370 ( a break above which brings 7400 into focus)
- Given the time of year and low levels of volatility usually associated with it (and a quiet economic calendar next week), we’re only looking for small moves


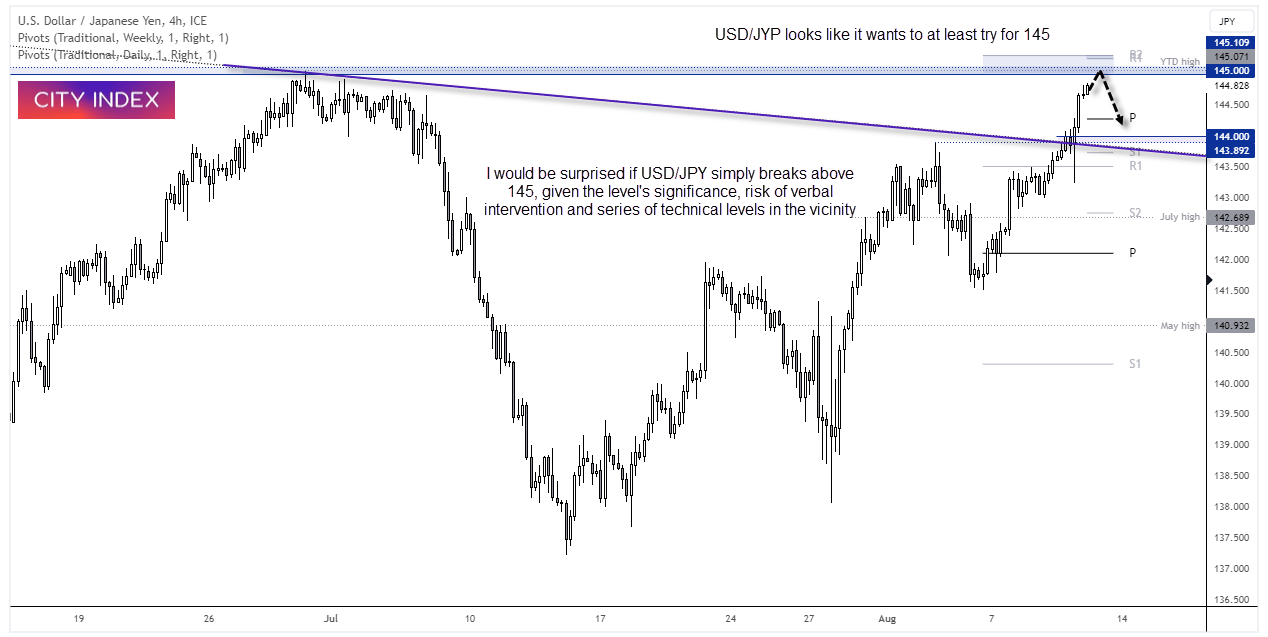
USD/JPY 4-hour chart:
USD/JPY rose to a 5-day high during its best day in eight, with much of the move happening before the CPI report. Early trade in Asia suggests that the pair is likely to test the 145 level, which is a key resistance level that has been associated with intervention from the MOF/BOJ in the past.
In July, USD/JPY rose to 145 before rolling over in anticipation of intervention from the MOF/BOJ. At the time, the central authorities were actively making comments about "yen volatility," but markets drove USD/JPY to 145 anyway. In June, USD/JPY fell back from 145 without any known intervention from the MOF/BOJ.
145 is clearly a level that is fresh in the minds of USD/JPY traders, and the question is whether we will see a similar retracement either today or early next week. Alternatively, markets may test the 145 level and wait for the MOF/BOJ to make their familiar comments about "closely watching FX" or "yen volatility."
Given the significance of the level, I suspect that markets will reach 145 and then pull back naturally. This provides traders who like to go long at highs the potential opportunity to trade in line with momentum to 145. At that point, a decision will need to be made as to whether to hope for the best, step aside, or switch to a countertrend trade. If or when the MOF/BOJ makes comments, it may also be accompanied by downside volatility.
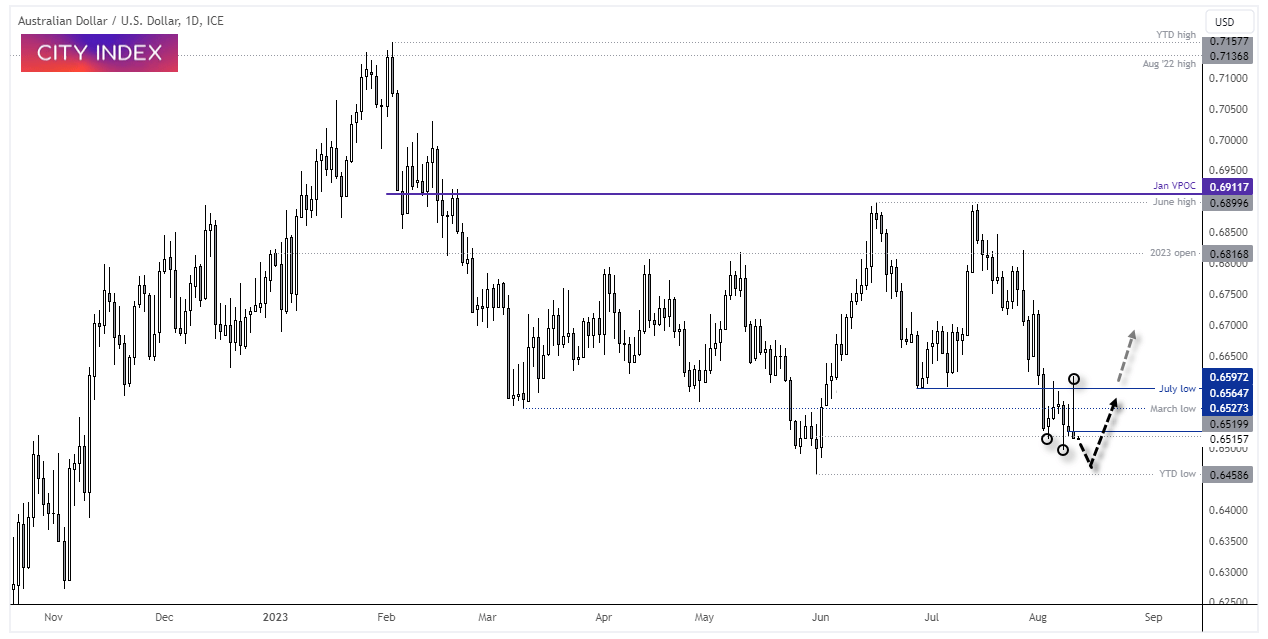
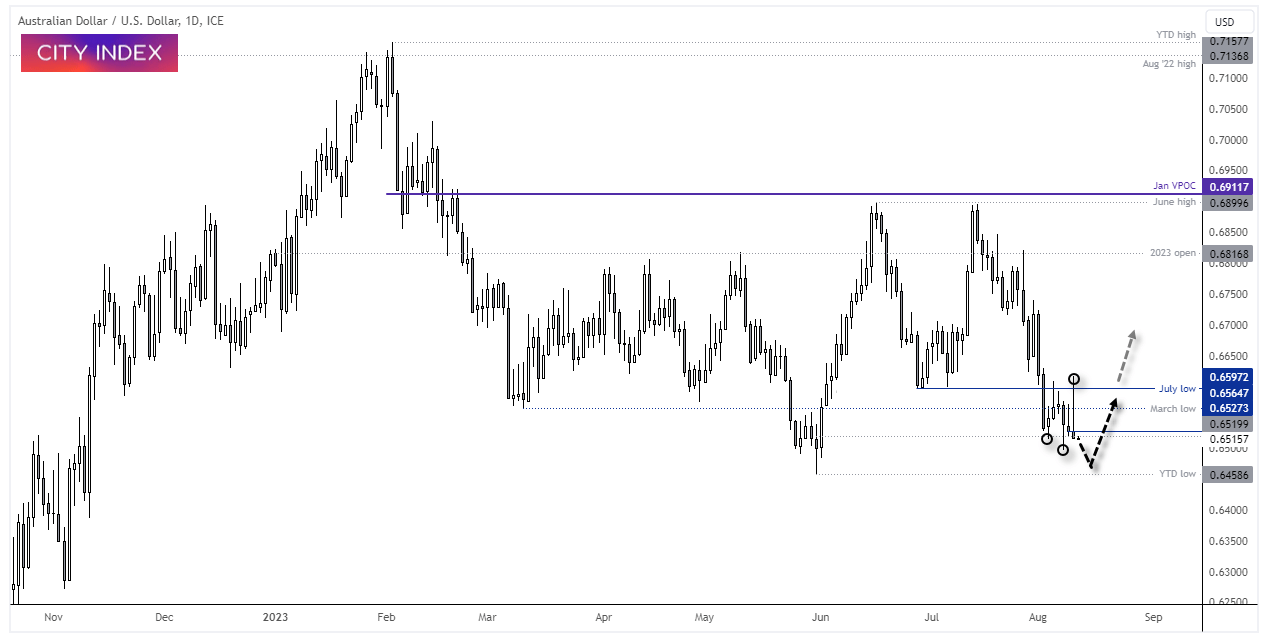
AUD/USD daily chart:
AUD/USD tried (but failed) to break above 66c. Which is a shame, because I had thought that the low had been reached on Tuesday, in line with my bullish bias.
The pair has been trading in a choppy 6-day range, with two upper wicks (spikes) and a lower wick. This makes it difficult to say with confidence what the next directional move will be in the near term. However, I suspect that there is at least some downside potential.
I still stick to my contrarian view that AUD/USD could hold above the YTD low, once the current choppiness subsides. With the economic calendar relatively quiet for the US next week, AUD/USD traders may need to rely on the RBA minutes and China data on Tuesday, and the RBNZ meeting on Wednesday, for hopes that volatility can pick up.
However, there appears to be a reasonable chance that conditions will remain choppy but less volatile, as traders find it difficult to commit to a bullish or bearish narrative with enough confidence to trigger a break beneath the YTD low or above the 66 cents high. Therefore, intraday setups are preferred.
-- Written by Matt Simpson
Follow Matt on Twitter @cLeverEdge
How to trade with City Index
You can trade with City Index by following these four easy steps:
- Open an account, or log in if you’re already a customer
• Open an account in the UK
• Open an account in Australia
• Open an account in Singapore
- Search for the market you want to trade in our award-winning platform
- Choose your position and size, and your stop and limit levels
- Place the trade
Related tags:
Latest market news




The complete CFD trading experience
Award-winning platforms, competitive spreads, low commissions and dedicated support.
We live and breathe the markets and are dedicated to helping traders realise their ambitions as we continue to set the industry bar.
Economic calendar
Web Trader platform
Our sophisticated web-based platform is packed with features.
Related articles
Gold Q4 2026 outlook: Resilience in the face of rallying dollar and yields
As we headed towards the latter stages of Q3 and into Q4, the Fed had just hiked rates in a hawkish FOMC meeting, while the likes of the ECB and BoJ had also tightened their respective policies. Oil prices remained elevated amid the prolonged US-Iran conflict. Meanwhile, bond yields were breaking out, and the dollar was higher across the board. Yet, remarkably, gold was still holding in the positive territory for the third quarter, even if it had weakened somewhat in September.
EUR/USD Q4 2026 Outlook: Euro at a Crossroads as Fed, ECB Tighten 9 25 2026
EUR/USD enters Q4 at a pivotal inflection point as competing Fed-ECB policy paths and persistent inflation risks collide with major technical support.

USD/JPY Q4 2026 Outlook: Hawkish Fed Pricing Clashes With Intervention Risk
The year-end tug-of-war is clear: hawkish Fed pricing supports USD/JPY, while intervention risk limits the upside.

StoneX Europe Ltd may make third party material available on this website which may contain information included but not limited to the conditions of financial markets. The material is for information purposes only and does not contain, and should not be construed as containing, investment advice and/or investment recommendation and/or an investment research and/or an offer of or solicitation for any transactions in financial instruments; any decision to enter into a specific transaction shall be made by the client following an assessment by him/her of their situation.
StoneX Europe Ltd makes no representation or warranty and assumes no liability as to the accuracy or completeness of the information provided, nor any loss arising from any investment based on a recommendation, forecast or other information supplied. You should always seek independent advice as to your suitability to speculate in any related markets and your ability to assume the associated risks, if you are at all unsure. We are not under any obligation to update any such material. Any opinion made may be personal to the author and may not reflect the opinion of StoneX Europe Ltd.