



Bitcoin Outlook: Bearish Sentiment Meets Key Support Levels
Bitcoin continues to struggle in regaining momentum alongside US indices, keeping overall risk sentiment tilted to the cautious side. The question remains: are we witnessing contrarian extremes, or is there one final drawdown ahead before the primary bull trend resumes?
Share this:

Key Events
• Bitcoin is struggling to regain momentum above the 70,000 zone, keeping broader risk sentiment capped.
• Extreme bearish sentiment hints at potential contrarian moves and a possible accumulation phase, yet key technical levels remain critical in assessing dip-buying potential.
CNN Fear and Greed Index
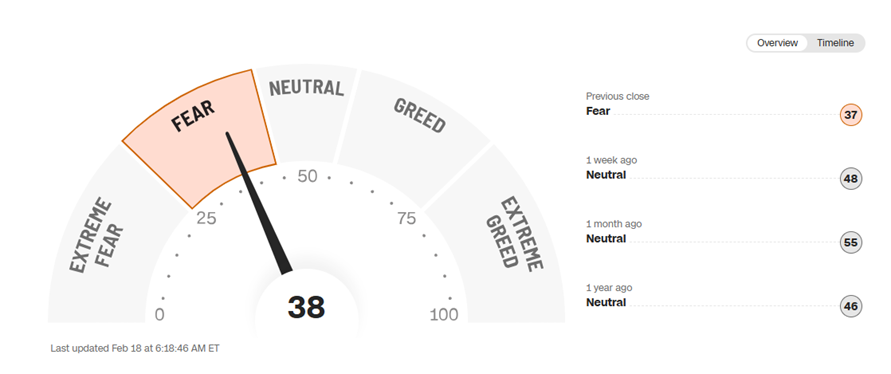
Source: CNN
With Bitcoin failing to reclaim 70,000, the Nasdaq unable to sustain levels above 25,000, and the Dow Jones holding below 50,000, risk sentiment is leaning increasingly cautious. This backdrop raises questions about whether further drawdowns are ahead or whether markets are approaching a contrarian reversal zone.
From a Bitcoin perspective, current momentum conditions are aligning with oversold levels last seen in 2022, suggesting the possibility of a near-term rebound. In contrast, US indices, particularly the Nasdaq, continue to reflect distribution risks, with five consecutive pullbacks recorded from the 26,000 threshold. Downside risks remain active should critical support levels fail.
This is where technical analysis becomes decisive, particularly ahead of potential catalysts such as improving sentiment, supportive crypto legislation, or clarity from FOMC minutes. Key levels will determine whether the current environment reflects short-term volatility or a structural shift in trend.
Technical Analysis: Quantifying Uncertainties
Bitcoin Outlook: Two Week Time Frame – Log Scale

Source: TradingView
From a two-week perspective, which filters out the noise of the weekly chart, the corrective cycle from the October 2025 highs near 126,000 appears to be stabilizing after reaching several technical milestones:
• The full projected target of the bearish wedge formation that developed between November 2024 and January 2026.
• Oversold RSI levels comparable to those seen in 2022, when Bitcoin traded near 15,000.
• Extended downside wicks reflecting rejection of sustained trade below the key 60,000 level.
This technical alignment improves the case for a bullish reversal. However, with sentiment still fragile, a decisive break below 60,000 could trigger one final drawdown toward the 50,000–48,000 zone, an area likely to attract strategic dip-buying interest.
On the upside, a sustained close above 75,000 followed by a reclaim of 80,000 would reassert bullish bias, exposing 100,000 and 110,000 before confirming the potential for another record rally toward 150,000 and possibly 200,000.
Bitcoin Outlook: Monthly Time Frame – Log Scale
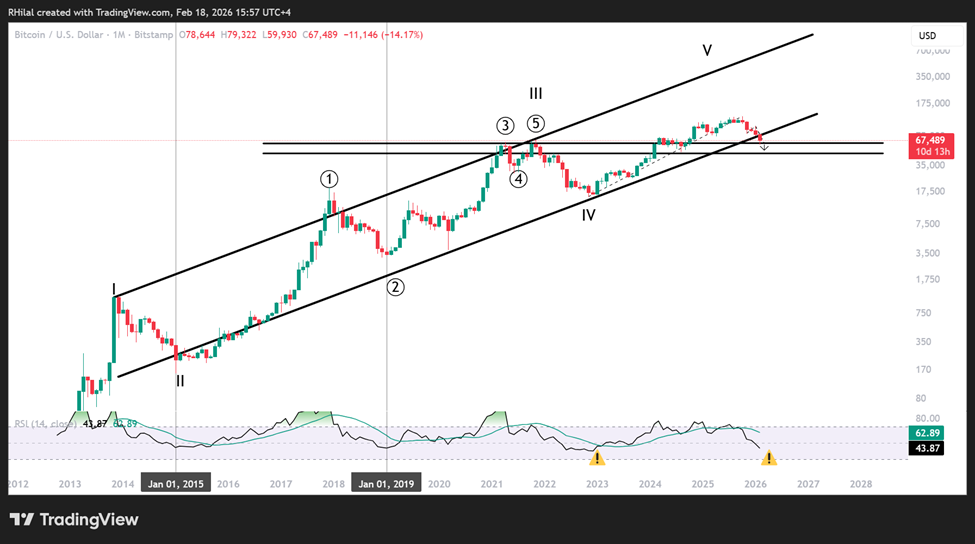
Source: TradingView
From a monthly and logarithmic perspective, Bitcoin’s price action is testing a potential bearish break below the bounds of the long-respected uptrend that has been in place since 2015. A sustained move below this structure would amplify downside pressure, particularly while price remains capped below the 80,000 threshold.
However, this same structure also reinforces the integrity of the long-term bull trend. A recovery back above 80,000, followed by a sustained move beyond 100,000, would reassert the broader bullish cycle and confirm that the current weakness remains corrective rather than structural.
Written by Razan Hilal, CMT
Follow on X: @Rh_waves
Related tags:



The complete CFD trading experience
Award-winning platforms, competitive spreads, low commissions and dedicated support.
We live and breathe the markets and are dedicated to helping traders realise their ambitions as we continue to set the industry bar.
Economic calendar
Web Trader platform
Our sophisticated web-based platform is packed with features.
Related articles
Crypto Outlook: Fears of a More Aggressive Fed Return to the Market
With September nearing its end, the cryptocurrency market is beginning to show greater caution heading into the close of the week. This comes after a strong start, when prices moved sharply higher on the back of short-covering activity and renewed optimism surrounding potential regulatory developments for the crypto industry.

EUR/USD Q4 2026 Outlook: Euro at a Crossroads as Fed, ECB Tighten 9 25 2026
EUR/USD enters Q4 at a pivotal inflection point as competing Fed-ECB policy paths and persistent inflation risks collide with major technical support.


USD/JPY Q4 2026 Outlook: Hawkish Fed Pricing Clashes With Intervention Risk
The year-end tug-of-war is clear: hawkish Fed pricing supports USD/JPY, while intervention risk limits the upside.

StoneX Europe Ltd may make third party material available on this website which may contain information included but not limited to the conditions of financial markets. The material is for information purposes only and does not contain, and should not be construed as containing, investment advice and/or investment recommendation and/or an investment research and/or an offer of or solicitation for any transactions in financial instruments; any decision to enter into a specific transaction shall be made by the client following an assessment by him/her of their situation.
StoneX Europe Ltd makes no representation or warranty and assumes no liability as to the accuracy or completeness of the information provided, nor any loss arising from any investment based on a recommendation, forecast or other information supplied. You should always seek independent advice as to your suitability to speculate in any related markets and your ability to assume the associated risks, if you are at all unsure. We are not under any obligation to update any such material. Any opinion made may be personal to the author and may not reflect the opinion of StoneX Europe Ltd.