





Brexit Deal is Fingertip Close
Brexit headlines have been in the driver’s seat
Share this:

Brexit headlines have been in the driver’s seat as far as the Great British Pound is concerned. As my colleague Ken Odeluga wrote earlier, it looks like the coming hours will tell whether pullbacks of the pound and related assets will gather pace. Throughout the day, more and more headlines have come out, which in this case, are continuing to push Sterling to higher levels. Although there will not be a deal today, it appears negotiators are close to an agreement. The latest developments are as follows:
- UK Cabinet Minister say the Brexit deal is “fingertip close” (Daily Mail)
- EU27 ambassadors have been told that all issues have been agreed, except the VAT (Buzzfeed)
- French President Macron says an agreement is being finalised (Reuters)
- According to the Guardian, ERG Chair Steve Baker said the EU leaders need to see the treaty text. If will be difficult for them to endorse at the summit without the text, however they will continue working throughout the night.
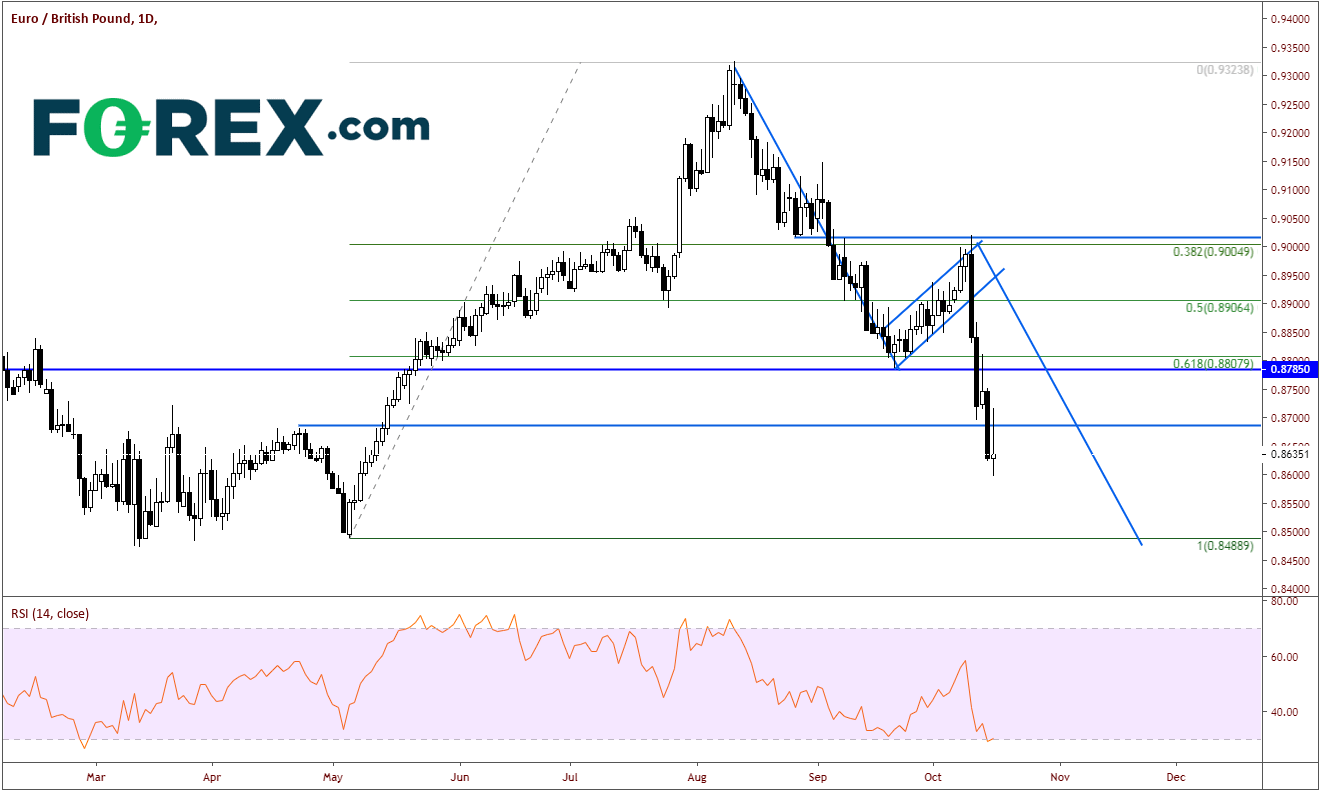
The two most affected currencies of a Brexit deal (or lack of a deal) are the Euro and the Pound. On a daily chart, EUR/GBP has been trading lower since the August 12th highs at .9324. Once price fell to horizontal support and the 61.8% retracement from the May 6th lows to the August 12th highs, the pair bounced to the 38.2% retracement level and the psychological resistance near .9000. In an almost textbook patterning, price broke lower, forming a flag formation which targets .8490, the May 6th lows. Price fell relatively quick over the last few days and put in a marginal new low today. Along with a close to oversold RSI, bears are hoping the pair may be due for a bounce towards the .8785 level where they can add to short positions.
Source: Tradingview, City Index
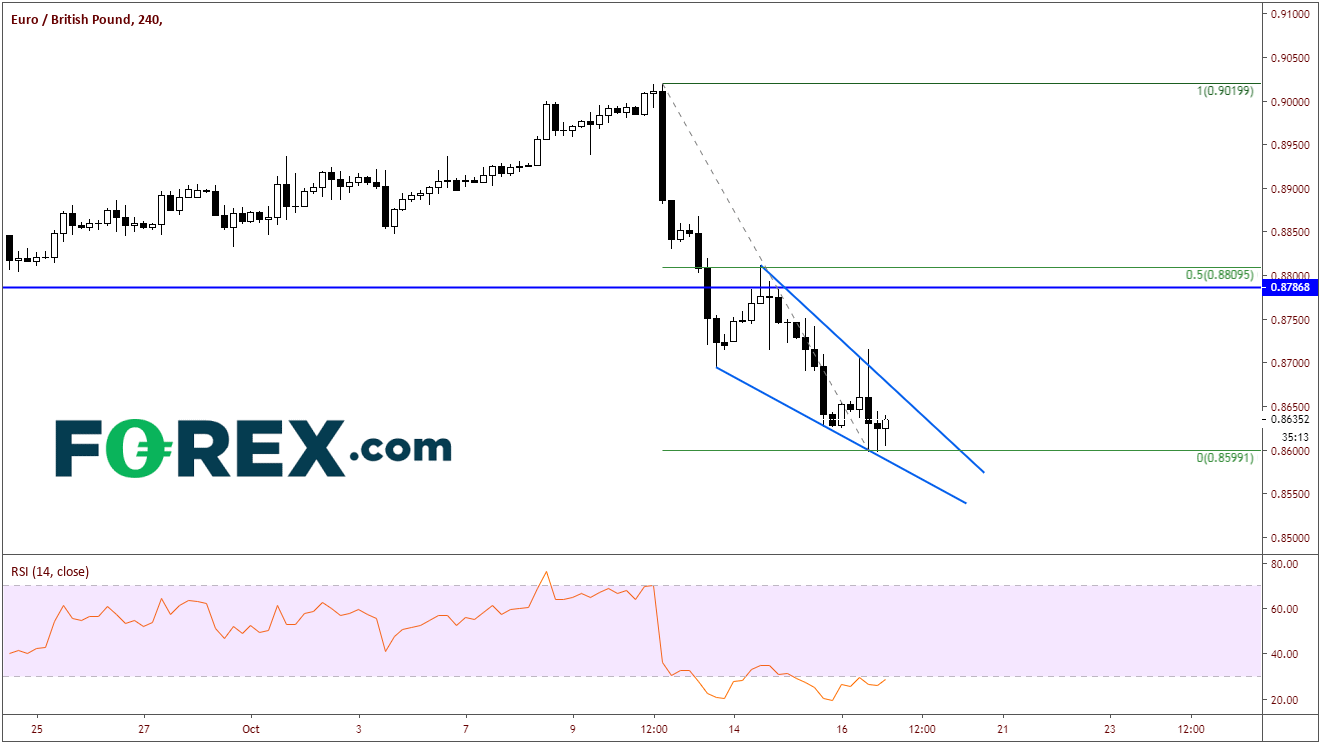
On a shorter-term time-frame, the RSI shows just how oversold EUR/GBP actually is, AND it is diverging from price, an early indication the pair may bounce. Price has also formed a falling wedge pattern. If price were to break out higher from the falling wedge, the target would be a 100% retracement of the wedge, which is .8810. This level coincidentally (or not) also happens to be the 50% retracement from the highs on October 10th to todays lows. Horizontal resistance comes in just below that there at .8787. Support comes in at the May 6th lows at .8490 (which is also the target for the flag pattern on the daily). Below that, price can drop all the way to horizontal support from 2016 and 2017 near .8300 (not shown).
Source: Tradingview, City Index
It appears now that a Brexit deal is in sight, however be aware that when a something is considered 99% done, that 1% seems to find a way of potentially messing things up!
Brexit headlines have been in the driver’s seat as far as the Great British Pound is concerned. As my colleague Ken Odeluga wrote earlier, it looks like the coming hours will tell whether pullbacks of the pound and related assets will gather pace. Throughout the day, more and more headlines have come out, which in this case, are continuing to push Sterling to higher levels. Although there will not be a deal today, it appears negotiators are close to an agreement. The latest developments are as follows:
- UK Cabinet Minister say the Brexit deal is “fingertip close” (Daily Mail)
- EU27 ambassadors have been told that all issues have been agreed, except the VAT (Buzzfeed)
- French President Macron says an agreement is being finalised (Reuters)
- According to the Guardian, ERG Chair Steve Baker said the EU leaders need to see the treaty text. If will be difficult for them to endorse at the summit without the text, however they will continue working throughout the night.
The two most affected currencies of a Brexit deal (or lack of a deal) are the Euro and the Pound. On a daily chart, EUR/GBP has been trading lower since the August 12th highs at .9324. Once price fell to horizontal support and the 61.8% retracement from the May 6th lows to the August 12th highs, the pair bounced to the 38.2% retracement level and the psychological resistance near .9000. In an almost textbook patterning, price broke lower, forming a flag formation which targets .8490, the May 6th lows. Price fell relatively quick over the last few days and put in a marginal new low today. Along with a close to oversold RSI, bears are hoping the pair may be due for a bounce towards the .8785 level where they can add to short positions.
Source: Tradingview, FOREX.com
On a shorter-term time-frame, the RSI shows just how oversold EUR/GBP actually is, AND it is diverging from price, an early indication the pair may bounce. Price has also formed a falling wedge pattern. If price were to break out higher from the falling wedge, the target would be a 100% retracement of the wedge, which is .8810. This level coincidentally (or not) also happens to be the 50% retracement from the highs on October 10th to todays lows. Horizontal resistance comes in just below that there at .8787. Support comes in at the May 6th lows at .8490 (which is also the target for the flag pattern on the daily). Below that, price can drop all the way to horizontal support from 2016 and 2017 near .8300 (not shown).
Source: Tradingview, FOREX.com
It appears now that a Brexit deal is in sight, however be aware that when a something is considered 99% done, that 1% seems to find a way of potentially messing things up!


The complete CFD trading experience
Award-winning platforms, competitive spreads, low commissions and dedicated support.
We live and breathe the markets and are dedicated to helping traders realise their ambitions as we continue to set the industry bar.
Economic calendar
Web Trader platform
Our sophisticated web-based platform is packed with features.
Related articles

Euro Short-term Outlook: EUR/USD Selloff Nears Critical Yearly Support 9 23 2026
Euro has fallen seven of the past nine sessions, with stretched momentum raising the stakes as EUR/USD closes in on a major inflection zone.


GBP/USD forecast: US dollar surges as bonds implode
The US dollar continued to press higher deep into the European session, supported by the slump in the bond markets as yields broke out across the curve. Following the recent hawkish Fed rate hike, yield spreads between the US and the rest of the world has continually increased, and that motion continued today, helped in part by some forecast-beating US macro data and hawkish Fed commentary.


Australian Dollar Technical Outlook: AUD/USD Breakdown Threatens Deeper Correction 9 23 2026
AUD/USD remains under pressure after breaking key trend support, with the latest decline putting the focus on the next major downside pivot.
StoneX Europe Ltd may make third party material available on this website which may contain information included but not limited to the conditions of financial markets. The material is for information purposes only and does not contain, and should not be construed as containing, investment advice and/or investment recommendation and/or an investment research and/or an offer of or solicitation for any transactions in financial instruments; any decision to enter into a specific transaction shall be made by the client following an assessment by him/her of their situation.
StoneX Europe Ltd makes no representation or warranty and assumes no liability as to the accuracy or completeness of the information provided, nor any loss arising from any investment based on a recommendation, forecast or other information supplied. You should always seek independent advice as to your suitability to speculate in any related markets and your ability to assume the associated risks, if you are at all unsure. We are not under any obligation to update any such material. Any opinion made may be personal to the author and may not reflect the opinion of StoneX Europe Ltd.