




China A50 Index and CSC Financial Start Their New Upmove
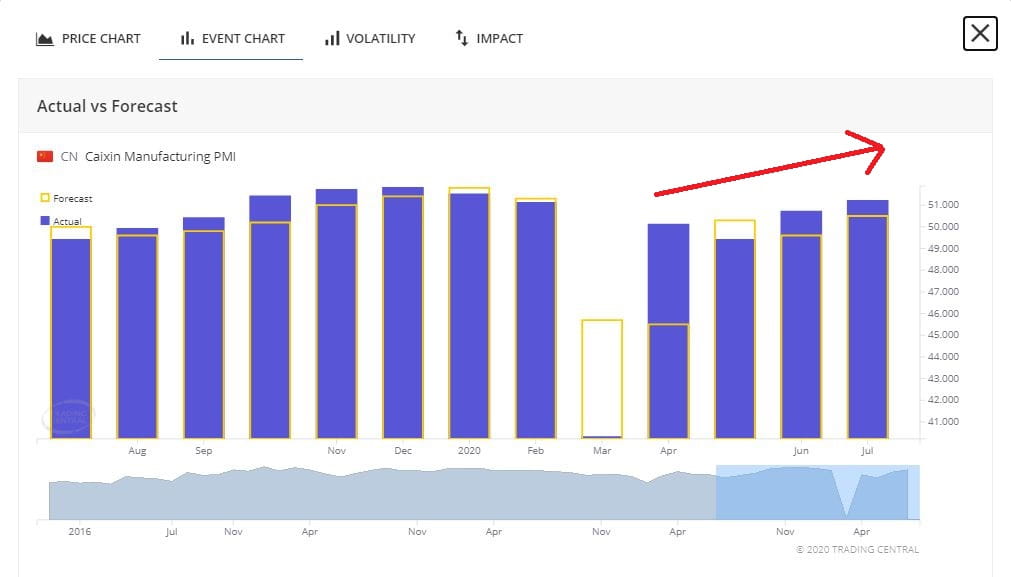
Yesterday, Caixin China manufacturing PMI rose to 51.2 in June (50.5 expected) from 50.7 in May. Key findings included: "Output expands again as sector continues to recover from COVID-19 crisis (...) Total new work increases for the first time since January. (...) but external demand remains subdued."
Share this:

Yesterday, Caixin China manufacturing PMI rose to 51.2 in June (50.5 expected) from 50.7 in May. Key findings included: "Output expands again as sector continues to recover from COVID-19 crisis (...) Total new work increases for the first time since January. (...) but external demand remains subdued."
Source: Trading Economics (Caixin China manufacturing PMI)
In the above chart, Caixin China manufacturing PMI has shown a recovery from March low. The data suggested that China's manufacturing activities are improving and expanding after the outbreak of COVID-19.
China A50 Index: Furthe Upside
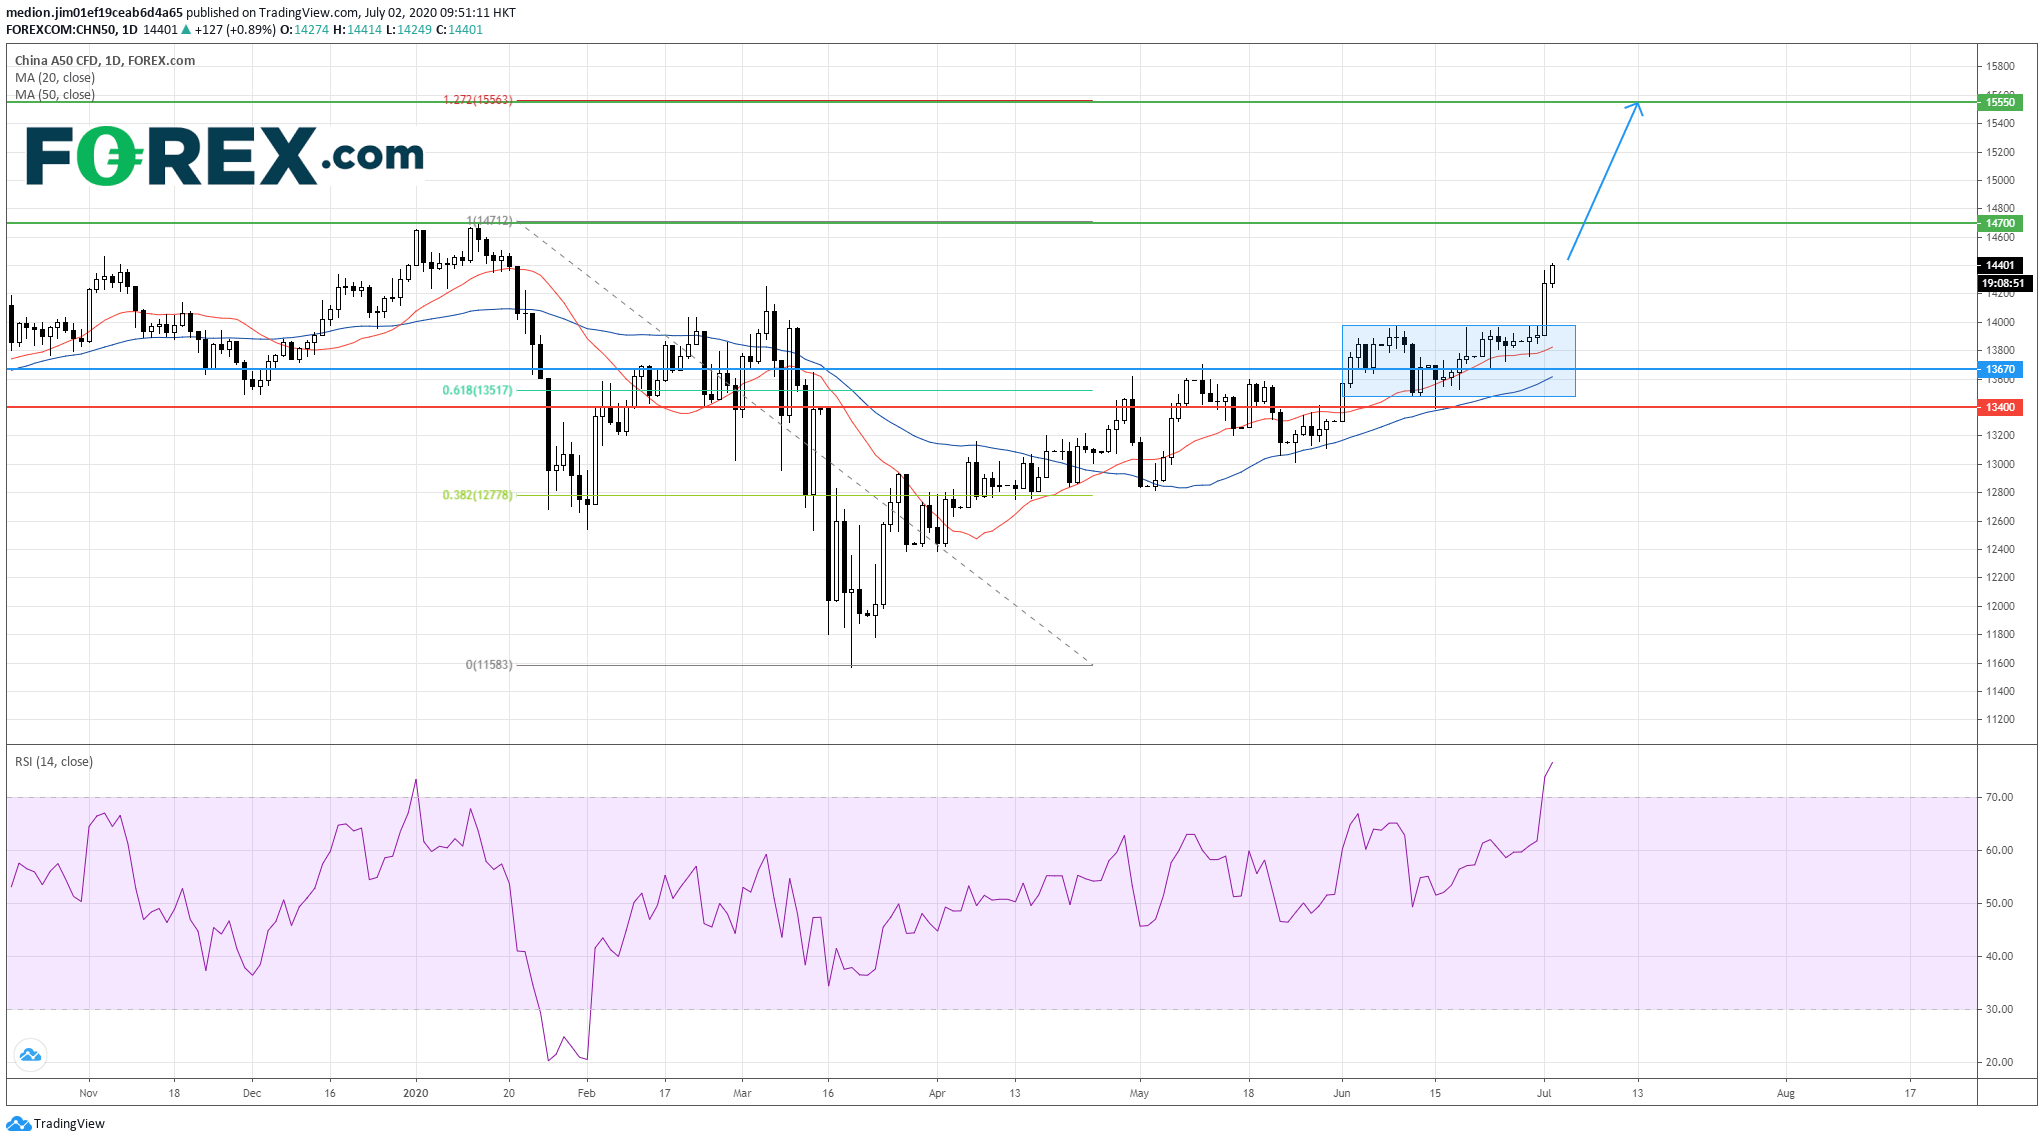
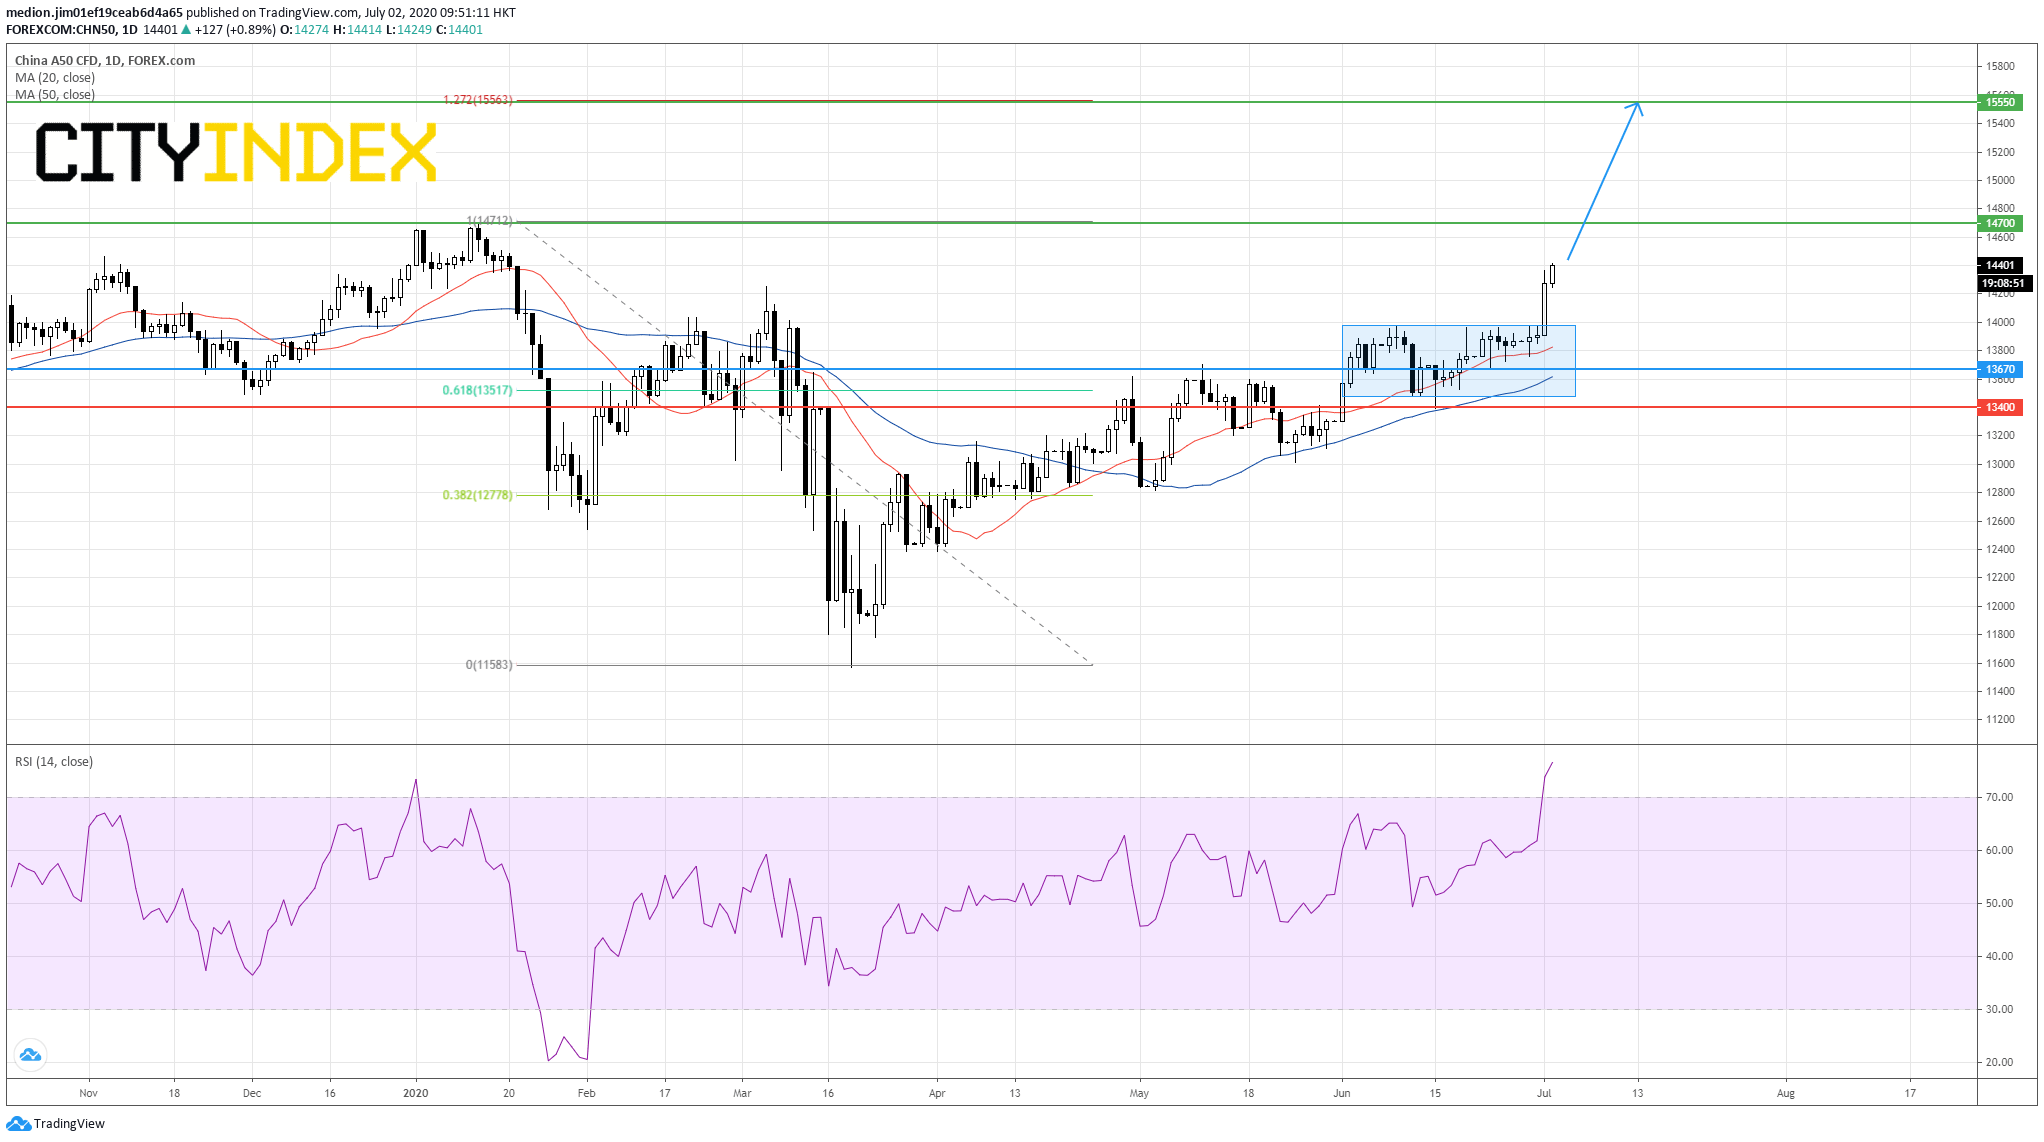
The RSI is above its overbought level at 70, but has not displayed any reversal signal.
Bullish readers should set the support level at 13670 (the low of June 23), while resistance levels would be located at 14700 (the high of January) and 15550 (127.2% retracement)
Source: GAIN Capital, TradingView
Hang Seng Index: Waiting for the breakout signal
Hong Kong's Hang Seng Index jumped more than 1% after the holiday of SAR Establishment Day. In fact, The technical outlook Hang Seng Index is still mixed as the prices are trading within the narrow zone, which is drawn by a declining trend line from March and a rising trend line from May.
Investors should focus on the breakout signal to confirm the resumption of the uptrend. Only a break above 25050 (the high of June 24) would trigger a rise to fill the gap at 26000.
Alternatively, a break below 23700 (the low of June 15) would continue the choppy trading and might return to 22500 (the low of May).

Source: GAIN Capital, TradingView
CSC Financial(6066.HK): Rounded bottom breakout
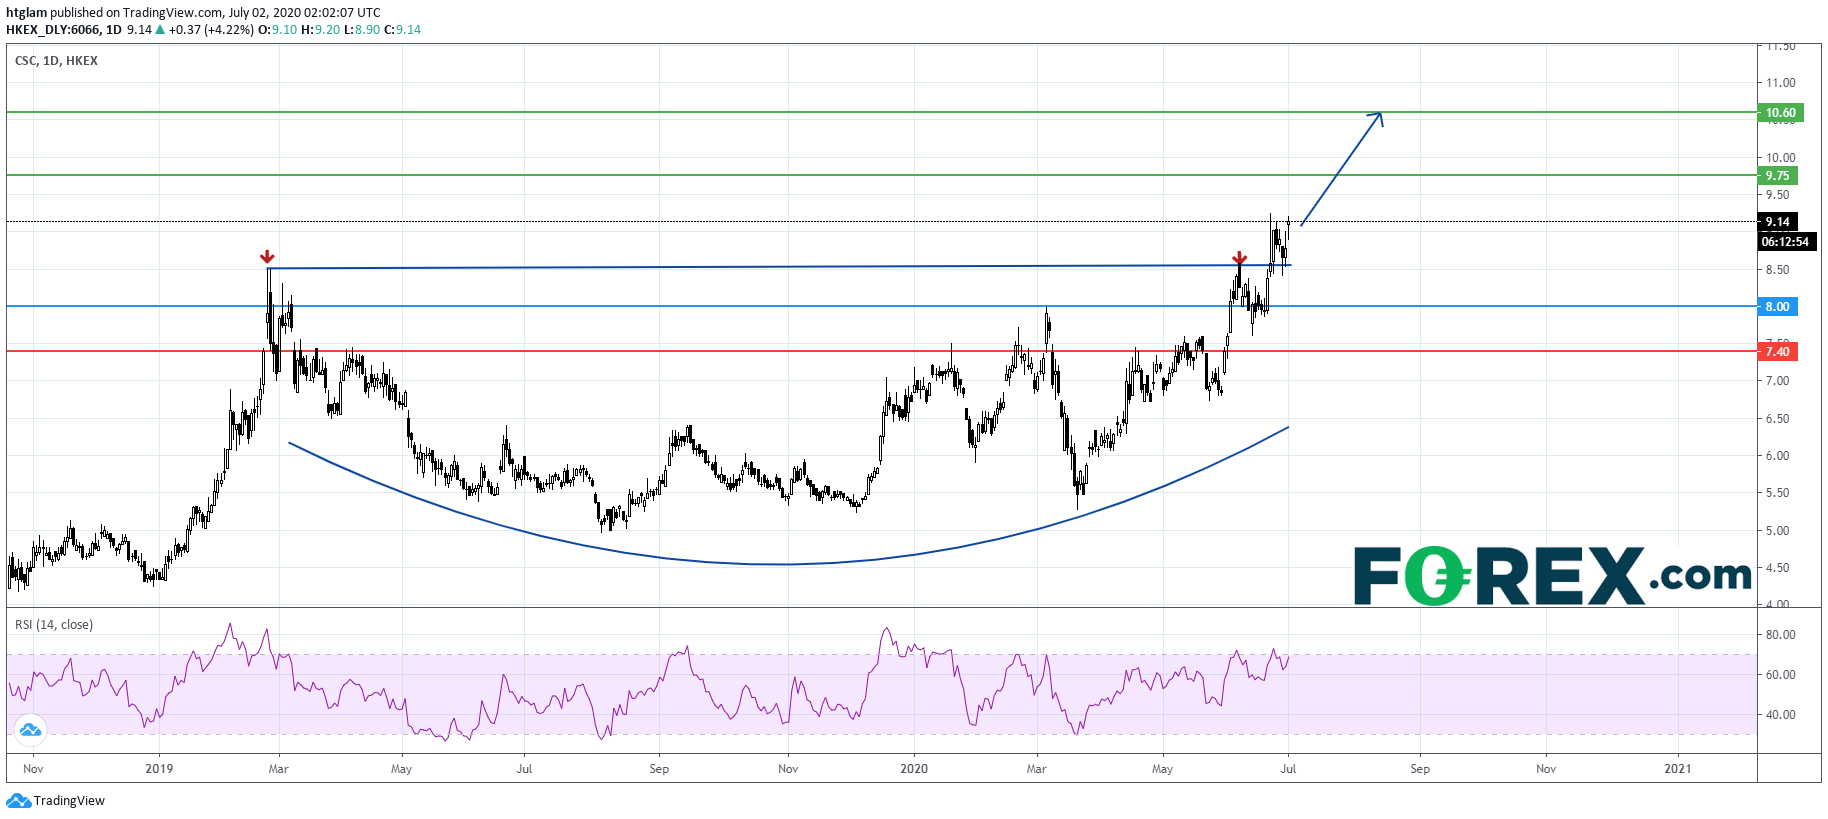
From a technical point of view, investment management group CSC Financial (6066.HK) is gathering upside momentum as shown on the daily chart. In fact, it has broken above its previous double-top, marked in June this year and February last year, after forming a rounded bottom pattern. Bullish investors may consider $8.00 as the nearest support, with prices trending to test the 1st and 2nd resistance at $9.75 and $10.60 respectively. Alternatively, a break below $8.00 is likely to trigger a pull-back to the next support at $7.40.

Source: GAIN Capital, TradingView
Source: Trading Economics (Caixin China manufacturing PMI)
In the above chart, Caixin China manufacturing PMI has shown a recovery from March low. The data suggested that China's manufacturing activities are improving and expanding after the outbreak of COVID-19.
China A50 Index: Furthe Upside
China A50 Index is lifted by the solid Caixin China manufacturing PMI data. Technically, the Index broke above the consolidation zone between 13980 and 13480 on the daily chart, suggesting the resumption of the uptrend since March low.
The RSI is above its overbought level at 70, but has not displayed any reversal signal.
Bullish readers should set the support level at 13670 (the low of June 23), while resistance levels would be located at 14700 (the high of January) and 15550 (127.2% retracement)
Source: GAIN Capital, TradingView
Hang Seng Index: Waiting for the breakout signal
Hong Kong's Hang Seng Index jumped more than 1% after the holiday of SAR Establishment Day. In fact, The technical outlook Hang Seng Index is still mixed as the prices are trading within the narrow zone, which is drawn by a declining trend line from March and a rising trend line from May.
Investors should focus on the breakout signal to confirm the resumption of the uptrend. Only a break above 25050 (the high of June 24) would trigger a rise to fill the gap at 26000.
Alternatively, a break below 23700 (the low of June 15) would continue the choppy trading and might return to 22500 (the low of May).
Source: GAIN Capital, TradingView
CSC Financial(6066.HK): Rounded bottom breakout
From a technical point of view, investment management group CSC Financial (6066.HK) is gathering upside momentum as shown on the daily chart. In fact, it has broken above its previous double-top, marked in June this year and February last year, after forming a rounded bottom pattern. Bullish investors may consider $8.00 as the nearest support, with prices trending to test the 1st and 2nd resistance at $9.75 and $10.60 respectively. Alternatively, a break below $8.00 is likely to trigger a pull-back to the next support at $7.40.
Source: GAIN Capital, TradingView
Yesterday, Caixin China manufacturing PMI rose to 51.2 in June (50.5 expected) from 50.7 in May. Key findings included: "Output expands again as sector continues to recover from COVID-19 crisis (...) Total new work increases for the first time since January. (...) but external demand remains subdued."
Source: Trading Economics (Caixin China manufacturing PMI)
In the above chart, Caixin China manufacturing PMI has shown a recovery from March low. The data suggested that China's manufacturing activities are improving and expanding after the outbreak of COVID-19.
China A50 Index: Furthe Upside
China A50 Index is lifted by the solid Caixin China manufacturing PMI data. Technically, the Index broke above the consolidation zone between 13980 and 13480 on the daily chart, suggesting the resumption of the uptrend since March low.
The RSI is above its overbought level at 70, but has not displayed any reversal signal.
Bullish readers should set the support level at 13670 (the low of June 23), while resistance levels would be located at 14700 (the high of January) and 15550 (127.2% retracement)
Source: GAIN Capital, TradingView
Hang Seng Index: Waiting for the breakout signal
Hong Kong's Hang Seng Index jumped more than 1% after the holiday of SAR Establishment Day. In fact, The technical outlook Hang Seng Index is still mixed as the prices are trading within the narrow zone, which is drawn by a declining trend line from March and a rising trend line from May.
Investors should focus on the breakout signal to confirm the resumption of the uptrend. Only a break above 25050 (the high of June 24) would trigger a rise to fill the gap at 26000.
Alternatively, a break below 23700 (the low of June 15) would continue the choppy trading and might return to 22500 (the low of May).
Source: GAIN Capital, TradingView
CSC Financial(6066.HK): Rounded bottom breakout
From a technical point of view, investment management group CSC Financial (6066.HK) is gathering upside momentum as shown on the daily chart. In fact, it has broken above its previous double-top, marked in June this year and February last year, after forming a rounded bottom pattern. Bullish investors may consider $8.00 as the nearest support, with prices trending to test the 1st and 2nd resistance at $9.75 and $10.60 respectively. Alternatively, a break below $8.00 is likely to trigger a pull-back to the next support at $7.40.
Source: GAIN Capital, TradingView
Latest market news




The complete CFD trading experience
Award-winning platforms, competitive spreads, low commissions and dedicated support.
We live and breathe the markets and are dedicated to helping traders realise their ambitions as we continue to set the industry bar.
Economic calendar
Web Trader platform
Our sophisticated web-based platform is packed with features.
Related articles

S&P 500, Nasdaq, Dow Forecast: Rising Yields Test Rally Ahead of Nvidia, Fed 8 22 2026
S&P 500, Nasdaq and Dow test key technical levels as momentum fades, raising the risk of a deeper correction heading into a pivotal week.


Euro Forecast: Can July’s PMI Improvement Survive into August?
The Eurozone Manufacturing PMI is seen edging up to around 52.0, while Services PMI is expected to slip slightly to 51.5 - what could it do to EUR/USD?


Magnificent Seven Earnings Preview: Can Big Tech Reclaim AI Leadership?
The Magnificent Seven enter earnings with far more divided performance than in previous years, as investors increasingly distinguish between companies supplying the AI buildout and those funding it - what does that mean heading into earnings season?
StoneX Europe Ltd may make third party material available on this website which may contain information included but not limited to the conditions of financial markets. The material is for information purposes only and does not contain, and should not be construed as containing, investment advice and/or investment recommendation and/or an investment research and/or an offer of or solicitation for any transactions in financial instruments; any decision to enter into a specific transaction shall be made by the client following an assessment by him/her of their situation.
StoneX Europe Ltd makes no representation or warranty and assumes no liability as to the accuracy or completeness of the information provided, nor any loss arising from any investment based on a recommendation, forecast or other information supplied. You should always seek independent advice as to your suitability to speculate in any related markets and your ability to assume the associated risks, if you are at all unsure. We are not under any obligation to update any such material. Any opinion made may be personal to the author and may not reflect the opinion of StoneX Europe Ltd.