





Coronavirus Weaker PPI hitting AUDUSD
If China’s economy is slowing down, the Australian economy may slow down as well.
Share this:

Fears of an increase in the contagion of the coronavirus have been causing a selloff in the Australian Dollar across the board. As we have discussed during the US-China trade war, the Australian economy is directly tied to China’s economy. China is a large importer of Australian goods and services. Therefore, if China’s economy is to slow down because of the Coronavirus, the Australian economy may slow down as well. There have already been talks of the virus knocking off up to 2% off Q1 GDP for China. Businesses are temporarily shutting down. Airlines are halting flights to China for as long as 3 months (Delta Airlines just announced). All of this is causing a slowdown in China, and therefore, a potential slowdown in Australia.
In addition, the latest inflation data is not helping. Earlier, Australia released the PPI data for Q4. The actual print was 0.3% vs 0.5% expected and 0.4% previous. Add bad economic data into the mix, and it’s a recipe for AUD/USD to trade lower into the weekend.
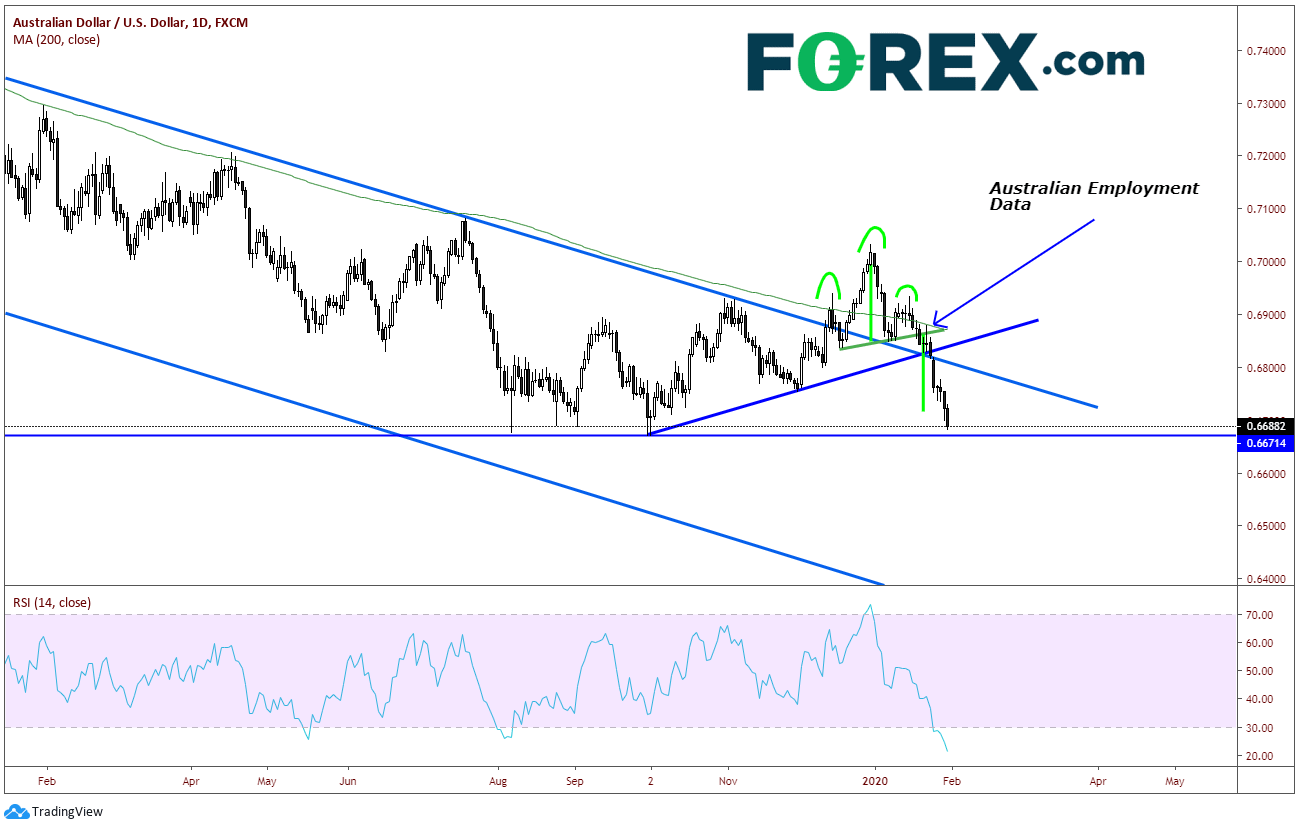
Last week, we discussed how AUD/USD was at an inflection point ahead of Employment data. The headline data was better than expected, and it gave the pair a temporary bounce. As we had discussed last week, AUD/USD was at a confluence of support and resistance areas, including trendline, necklines, moving averages, and Fibonacci Retracement levels. However, as news of the Coronavirus began to spread, price broke lower, and quickly hit the target of the head and shoulders pattern near .6720.
Source: Tradingview, City Index
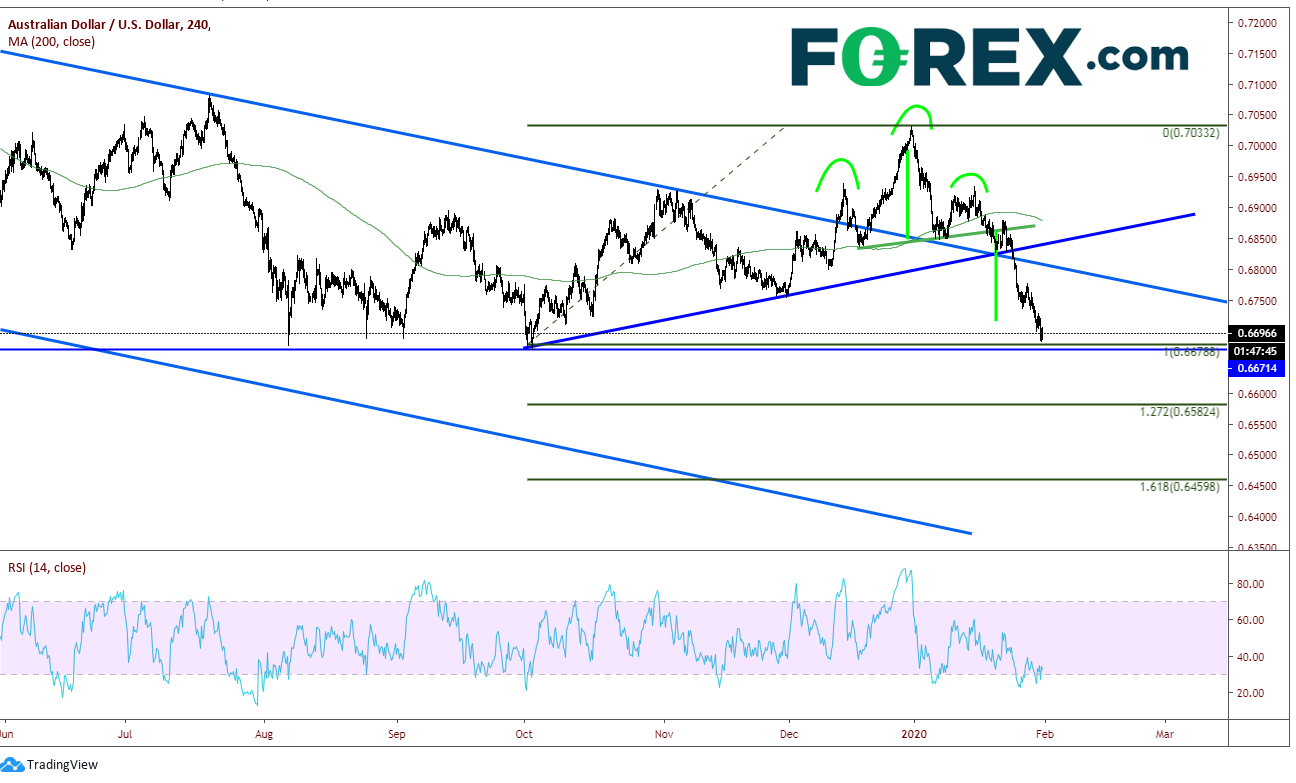
Price is currently closing in on recent lows from late summer near .6670, which are levels that haven’t been seen since 2009. If price breaks .6670, we must look for Fibonacci extensions for next possible support levels. .6582 is the 127.2% extension from the October 2nd low to the December 31st high. The next Fibonacci extension level is the 161.8% extension at .6460. Horizonal resistance above at .6750, and then the downward sloping trendline from back in June 2018 near .6800. The previous support zone (which now acts as resistance) from before the employment data begins at .6825.
Source: Tradingview, City Index
The fear of the virus spreading is real. The low PPI data earlier is real. The actuality of it spreading, or slowing down of the Chinese economy, may or may not be as real. We have data to determine whether fundamentals and technicals are getting better or worse. We don’t have as much data for the coronavirus. Continue to watch the rate at which the virus is spreading, the number of multi nationals temporarily shutting down operations in China, and these key markets. This will help to put the severity of the issue into better context.
Fears of an increase in the contagion of the coronavirus have been causing a selloff in the Australian Dollar across the board. As we have discussed during the US-China trade war, the Australian economy is directly tied to China’s economy. China is a large importer of Australian goods and services. Therefore, if China’s economy is to slow down because of the Coronavirus, the Australian economy may slow down as well. There have already been talks of the virus knocking off up to 2% off Q1 GDP for China. Businesses are temporarily shutting down. Airlines are halting flights to China for as long as 3 months (Delta Airlines just announced). All of this is causing a slowdown in China, and therefore, a potential slowdown in Australia.
In addition, the latest inflation data is not helping. Earlier, Australia released the PPI data for Q4. The actual print was 0.3% vs 0.5% expected and 0.4% previous. Add bad economic data into the mix, and it’s a recipe for AUD/USD to trade lower into the weekend.
Last week, we discussed how AUD/USD was at an inflection point ahead of Employment data. The headline data was better than expected, and it gave the pair a temporary bounce. As we had discussed last week, AUD/USD was at a confluence of support and resistance areas, including trendline, necklines, moving averages, and Fibonacci Retracement levels. However, as news of the Coronavirus began to spread, price broke lower, and quickly hit the target of the head and shoulders pattern near .6720.
Source: Tradingview, FOREX.com
Price is currently closing in on recent lows from late summer near .6670, which are levels that haven’t been seen since 2009. If price breaks .6670, we must look for Fibonacci extensions for next possible support levels. .6582 is the 127.2% extension from the October 2nd low to the December 31st high. The next Fibonacci extension level is the 161.8% extension at .6460. Horizonal resistance above at .6750, and then the downward sloping trendline from back in June 2018 near .6800. The previous support zone (which now acts as resistance) from before the employment data begins at .6825.
Source: Tradingview, FOREX.com
The fear of the virus spreading is real. The low PPI data earlier is real. The actuality of it spreading, or slowing down of the Chinese economy, may or may not be as real. We have data to determine whether fundamentals and technicals are getting better or worse. We don’t have as much data for the coronavirus. Continue to watch the rate at which the virus is spreading, the number of multi nationals temporarily shutting down operations in China, and these key markets. This will help to put the severity of the issue into better context.
Latest market news




The complete CFD trading experience
Award-winning platforms, competitive spreads, low commissions and dedicated support.
We live and breathe the markets and are dedicated to helping traders realise their ambitions as we continue to set the industry bar.
Economic calendar
Web Trader platform
Our sophisticated web-based platform is packed with features.
Related articles
EUR/USD Q4 2026 Outlook: Euro at a Crossroads as Fed, ECB Tighten 9 25 2026
EUR/USD enters Q4 at a pivotal inflection point as competing Fed-ECB policy paths and persistent inflation risks collide with major technical support.

USD/JPY Q4 2026 Outlook: Hawkish Fed Pricing Clashes With Intervention Risk
The year-end tug-of-war is clear: hawkish Fed pricing supports USD/JPY, while intervention risk limits the upside.


Japanese Yen Forecast: USD/JPY 4% Rally Challenges Post-Intervention Downtrend 9 24 2026
USD/JPY momentum has shifted sharply higher, putting a major resistance confluence in focus as U.S. and Japanese event risk builds.
StoneX Europe Ltd may make third party material available on this website which may contain information included but not limited to the conditions of financial markets. The material is for information purposes only and does not contain, and should not be construed as containing, investment advice and/or investment recommendation and/or an investment research and/or an offer of or solicitation for any transactions in financial instruments; any decision to enter into a specific transaction shall be made by the client following an assessment by him/her of their situation.
StoneX Europe Ltd makes no representation or warranty and assumes no liability as to the accuracy or completeness of the information provided, nor any loss arising from any investment based on a recommendation, forecast or other information supplied. You should always seek independent advice as to your suitability to speculate in any related markets and your ability to assume the associated risks, if you are at all unsure. We are not under any obligation to update any such material. Any opinion made may be personal to the author and may not reflect the opinion of StoneX Europe Ltd.