



Crude Oil Weekly Outlook: Progress in OPEC Outputs and Tariff Deals
Crude oil prices remain supported as OPEC agrees to proceed with a 137,000 barrel production increase, while the U.S. and China reach a one-year trade truce, setting the stage for potential longer-term stability in both crude prices and OPEC’s market share.
Share this:

Key Events
- OPEC confirms a modest 137,000-barrel output increase, while U.S.–China tariff negotiations continue in a constructive tone, raising hopes for a more sustainable recovery in oil prices.
- The agreement marks a temporary truce, not a comprehensive trade pact, and will require annual renegotiation.
- Meanwhile, the upcoming U.S. Non-Farm Payrolls (NFP) report, alongside the ongoing U.S. government shutdown, continues to cloud risk sentiment across markets.
The world’s two largest oil consumers, the United States and China, are extending their trade truce. The U.S. has reduced tariff magnitudes, while China has resumed large-scale purchases of U.S. agricultural goods, lifted export controls on rare earths (crucial for semiconductors and EVs), and paused retaliatory measures against U.S. technology firms.
Despite these constructive developments, oversupply risks heading into 2026 remain a concern for oil markets. This aligns with labor market uncertainty and demand potential, reinforcing the importance of upcoming macro data in shaping near-term price direction.
Technical Analysis: Quantifying Uncertainties
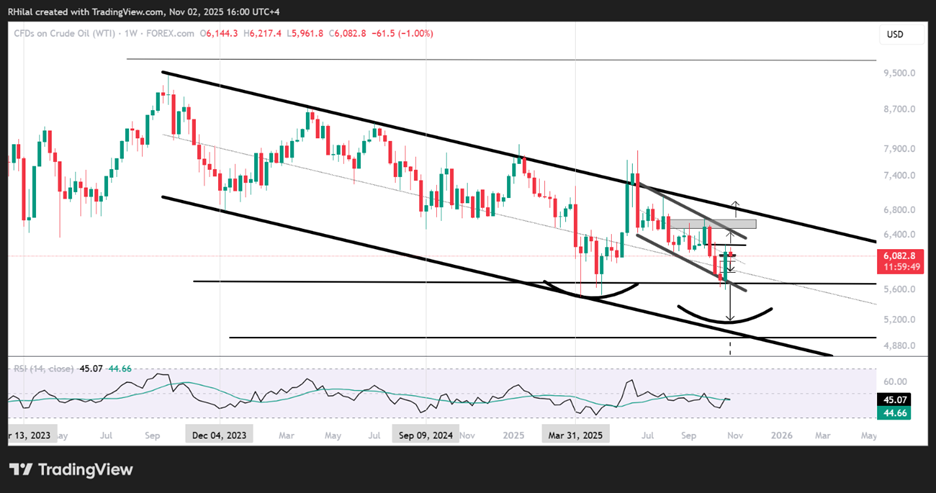
Crude Oil Outlook: Weekly Time Frame – Log Scale
Source: Trading view
Crude prices have rejected the yearly lows ($55) twice, leaving room for either the formation of a long-term double bottom or the possibility of another dip before establishing a sustainable uptrend.
- If the $55 support holds and price action moves above $60 and $62.50, upside targets align with the upper boundary of a downtrend channel established since 2022, converging near $65, $66.60, and $70.
- The $70 mark remains the technical pivot separating bullish from bearish bias.
- Conversely, a close below $59 risks further declines toward $58, $56.30, and $55 — the defining support zone. A decisive break below this region could expose deeper retracement levels near $49, and in more extreme cases, $37, before a structural rebound emerges.
The next three months will be crucial in determining whether crude consolidates within the current range or extends toward a more definitive reversal setup.
Crude Oil Outlook: 3-Month Time Frame – Log Scale
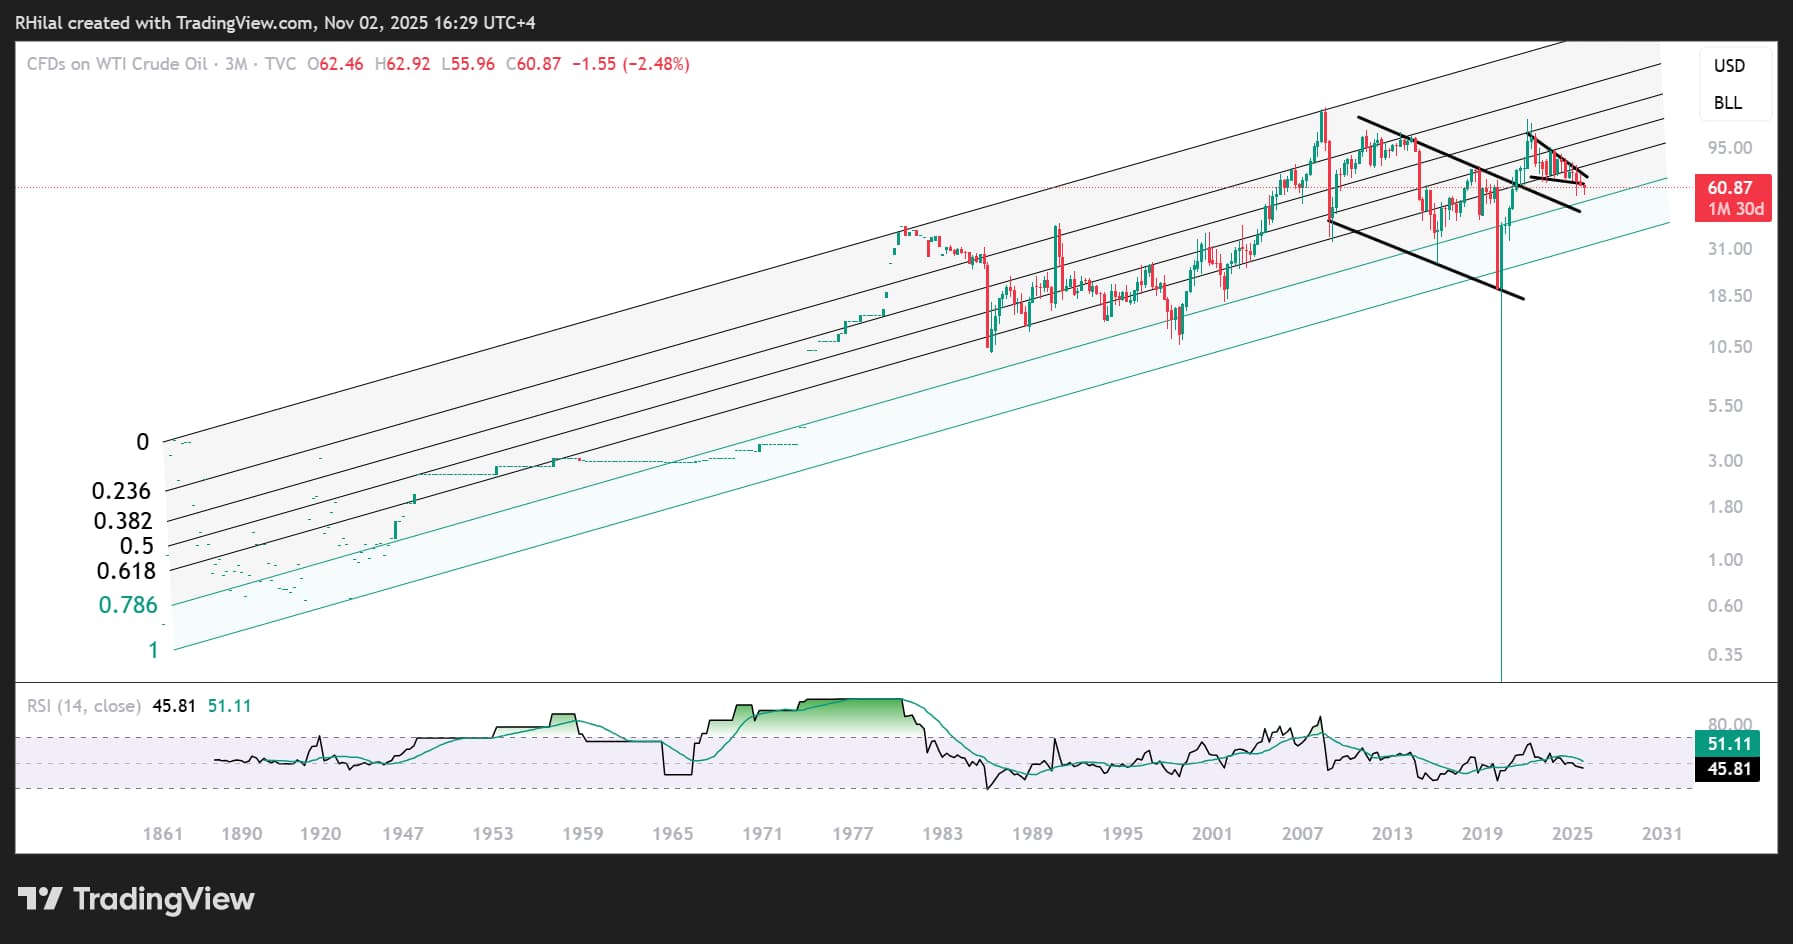
Over the three-month horizon, crude remains confined within a multi-decade channel, whose lower boundary extends back to the 1860s. The current price structure forms a pennant-like pattern sitting just above the historical support zone observed between 2008 and 2020.
This long-term configuration continues to suggest a broad bullish bias within an enduring secular uptrend, unless a clear structural breakdown occurs.
The combination of measured OPEC output policy, U.S.–China tariff de-escalation and tightening long-term technical structures paints a cautiously optimistic picture for oil. However, macroeconomic uncertainty, particularly from the U.S. labor market and fiscal gridlock — continues to pose near-term downside risks.
Written by Razan Hilal, CMT
Follow on X: @Rh_waves
Latest market news




The complete CFD trading experience
Award-winning platforms, competitive spreads, low commissions and dedicated support.
We live and breathe the markets and are dedicated to helping traders realise their ambitions as we continue to set the industry bar.
Economic calendar
Web Trader platform
Our sophisticated web-based platform is packed with features.
Related articles
US Dollar Short-term Outlook: USD Rally on the Line as Midterms, NFP Loom 11 3 2026
DXY is testing pivotal support, with the weekly range breakout likely to determine the next major leg of the trend as key event risk unfolds.

Australian Dollar Technical Outlook: AUD/USD October Breakout Reverses Toward Critical Support 11 3 2026
Aussie bulls face a critical test of rising trend support, with the October recovery under threat as selling pressure builds into November.

Silver outlook: a return to the 2011 high tests $49 to $50 support
Silver is testing key support at $49 to $50, the area of its 2011 high, and has yet to bounce. A bullish reversal candlestick would make the picture more constructive, but for now the near-term forecast hangs in the balance.

StoneX Europe Ltd may make third party material available on this website which may contain information included but not limited to the conditions of financial markets. The material is for information purposes only and does not contain, and should not be construed as containing, investment advice and/or investment recommendation and/or an investment research and/or an offer of or solicitation for any transactions in financial instruments; any decision to enter into a specific transaction shall be made by the client following an assessment by him/her of their situation.
StoneX Europe Ltd makes no representation or warranty and assumes no liability as to the accuracy or completeness of the information provided, nor any loss arising from any investment based on a recommendation, forecast or other information supplied. You should always seek independent advice as to your suitability to speculate in any related markets and your ability to assume the associated risks, if you are at all unsure. We are not under any obligation to update any such material. Any opinion made may be personal to the author and may not reflect the opinion of StoneX Europe Ltd.