


Crude Oil Weekly Outlook: U.S.–Iran Deal Hopes Ahead of Elections?
Crude oil weekly outlook: U.S.–Iran negotiations may be moving closer to a breakthrough as the U.S. midterm elections approach on Tuesday, bringing key resistance levels on crude oil charts into focus.
Share this:

U.S.–Iran negotiations may be moving closer to a breakthrough as the U.S. midterm elections approach on Tuesday, bringing key resistance levels on crude oil charts into focus.
Despite the stalemate outcome following the Israeli elections, the chances of a diplomatic breakthrough may be improving following intensified mediation efforts by Qatar and regional allies. Reports point to discussions about sanctions relief and reopening the Strait of Hormuz, while nuclear restrictions and inspections remain major unresolved issues.
With crude oil approaching key resistance levels while precious metals and equities test important support, reversal risks may be building. The scenarios below outline the levels I’m watching.
I cover these charts in my weekly webinar, held every Tuesday.
For more than eight months, headlines have swung between negotiation efforts and escalation risks. As the U.S. midterm elections approach and worldwide economic pressure and inflation concerns widen, a near-term agreement may be possible.
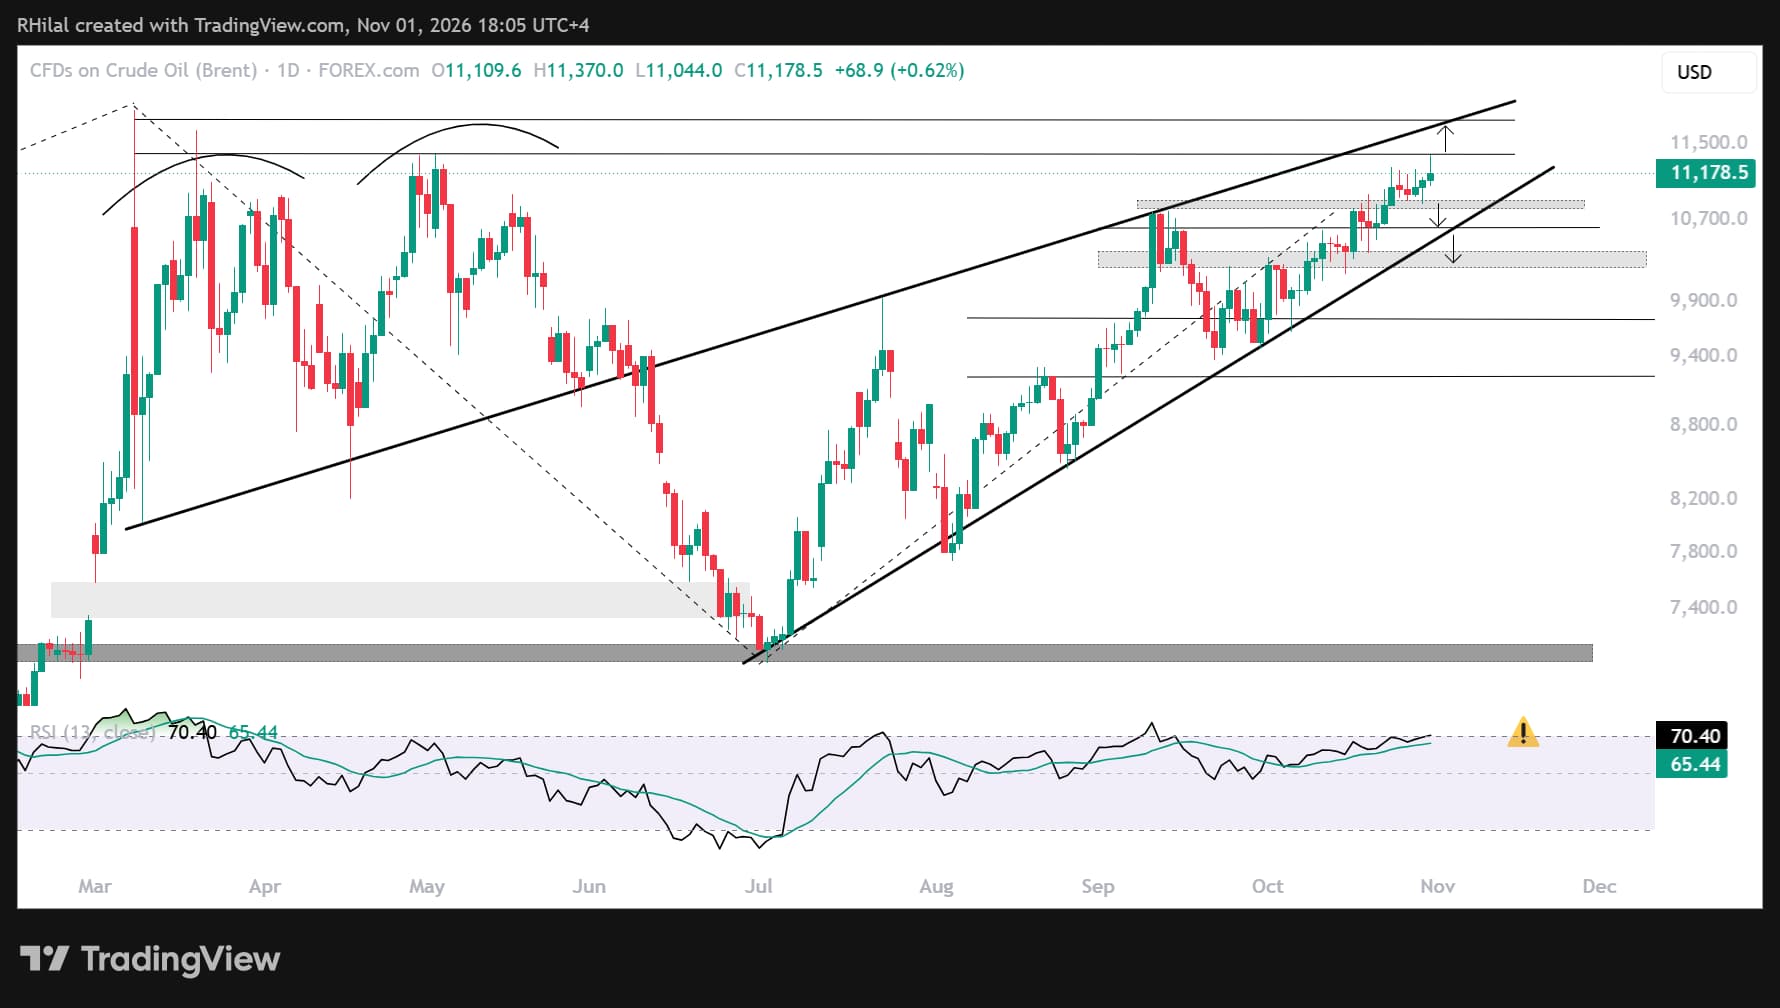
Brent Outlook: Daily Time Frame – Log Scale
Source: TradingView
On the daily chart, Brent is facing a technical confluence zone between $113.70 and $118, where a pullback could emerge. This zone aligns with the 2026 highs, an uptrend respected since March 2026, and daily RSI overbought conditions last seen in September, July and March—periods that preceded notable bearish reversals on the chart.
If this confluence holds and a bearish reversal develops, the key support levels I’m watching are near $108, $106 and $102. These levels align with the rising support established since July 2026. A break below $102 would invalidate this support structure and increase the risk of a steeper drawdown, potentially alongside an unwind in the geopolitical risk premium.
On the upside, a close above $118 would signal the potential for a longer-term bullish rally and deeper stress for markets.
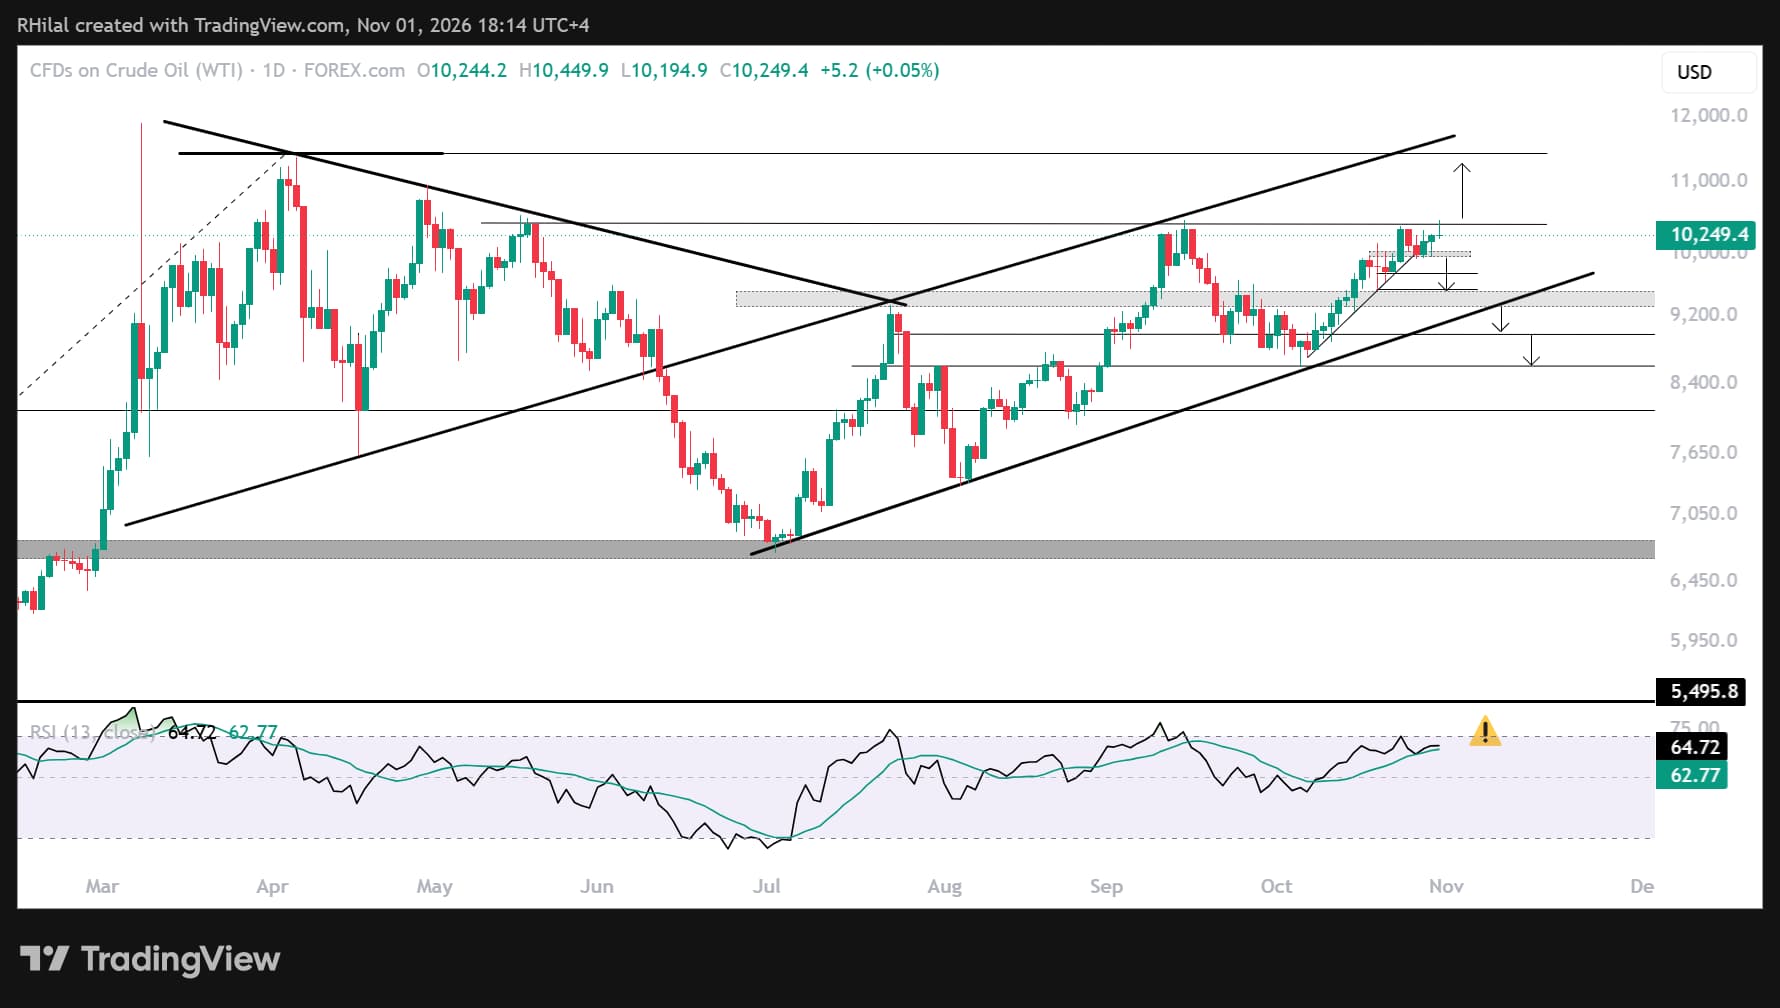
WTI Crude Oil Outlook: Daily Time Frame – Log Scale
Source: TradingView
WTI has pulled back from the $105 barrier three consecutive times, establishing a strong ceiling for price action. This level aligns with the 61.8% extension of the April 2025–March 2026–July 2026 price cycle.
A sustained close above $105 would bring the yearly highs and the trendline respected since March 2026 into focus, with potential resistance near $114. The yearly highs also align with a barrier respected since 2011. A sustained break above this zone would increase the risk of longer-term bullish continuation.
On the downside, I’m watching rising support near $99.50, connecting higher lows across October. A break below this level would be the first bearish signal, bringing the rising support established since July 2026—near $95 and $93—into focus. A move through those levels would increase the risk of a deeper corrective phase, potentially alongside a U.S.–Iran breakthrough.
For more than eight months, headlines have shifted between negotiations and escalation. With the U.S. midterm elections on Tuesday, November 3, and diplomatic efforts continuing, both geopolitical developments and the technical levels above are likely to shape crude oil’s next move.
Written by Razan Hilal, CMT
Follow on X: @Rh_waves
Latest market news




The complete CFD trading experience
Award-winning platforms, competitive spreads, low commissions and dedicated support.
We live and breathe the markets and are dedicated to helping traders realise their ambitions as we continue to set the industry bar.
Economic calendar
Web Trader platform
Our sophisticated web-based platform is packed with features.
Related articles
Crude Oil Weekly Outlook: U.S.–Iran Deal Hopes Ahead of Elections?
Crude oil weekly outlook: U.S.–Iran negotiations may be moving closer to a breakthrough as the U.S. midterm elections approach on Tuesday, bringing key resistance levels on crude oil charts into focus.
Crypto Analysis: Is Selling Pressure Making a Comeback?
As October enters its final stretch, one of the most relevant developments in the cryptocurrency market is that, after several weeks of neutrality, a more consistent phase of weakness is beginning to take shape. Throughout the week, none of the major cryptocurrencies has managed to sustain meaningful gains and, instead, selling pressure has gradually regained control across the sector.

EUR/USD Clings to Support as Lagarde Announces Early Departure
EUR/USD has been mired in a steep sell-off as worries have built around French yields, but continued support around the 1.1100 level give hope for a bounce that could possibly turn into something more.

StoneX Europe Ltd may make third party material available on this website which may contain information included but not limited to the conditions of financial markets. The material is for information purposes only and does not contain, and should not be construed as containing, investment advice and/or investment recommendation and/or an investment research and/or an offer of or solicitation for any transactions in financial instruments; any decision to enter into a specific transaction shall be made by the client following an assessment by him/her of their situation.
StoneX Europe Ltd makes no representation or warranty and assumes no liability as to the accuracy or completeness of the information provided, nor any loss arising from any investment based on a recommendation, forecast or other information supplied. You should always seek independent advice as to your suitability to speculate in any related markets and your ability to assume the associated risks, if you are at all unsure. We are not under any obligation to update any such material. Any opinion made may be personal to the author and may not reflect the opinion of StoneX Europe Ltd.