



Crude Oil Weekly Outlook: WTI Holds Above $97 as US–Iran Proposals Misalign, Supply Risks Persist
Crude Oil Weekly Outlook: US–Iran proposals remain misaligned, choking what could become the largest supply shock in history in terms of inventories and flows. This continues to support WTI and Brent in bullish territory, holding above $93 and $100, respectively.
Share this:

Weekly Drivers: Oil Prices, Geopolitics, and Supply Risks
- Trump stated that the latest Iranian peace proposal is unacceptable, following a bullish weekly close in crude prices, above $96.
- OPEC’s Sunday meeting highlighted the group’s unity despite the UAE’s exit, announcing a symbolic production increase of 188,000 barrels for June. However, production quotas remain ineffective as long as the Hormuz Strait stays disrupted, stranding and threatening tanker flows.
- Hormuz blockages and facility strikes are extending the recovery timeline required for the region to restore oil and gas supply capacity.
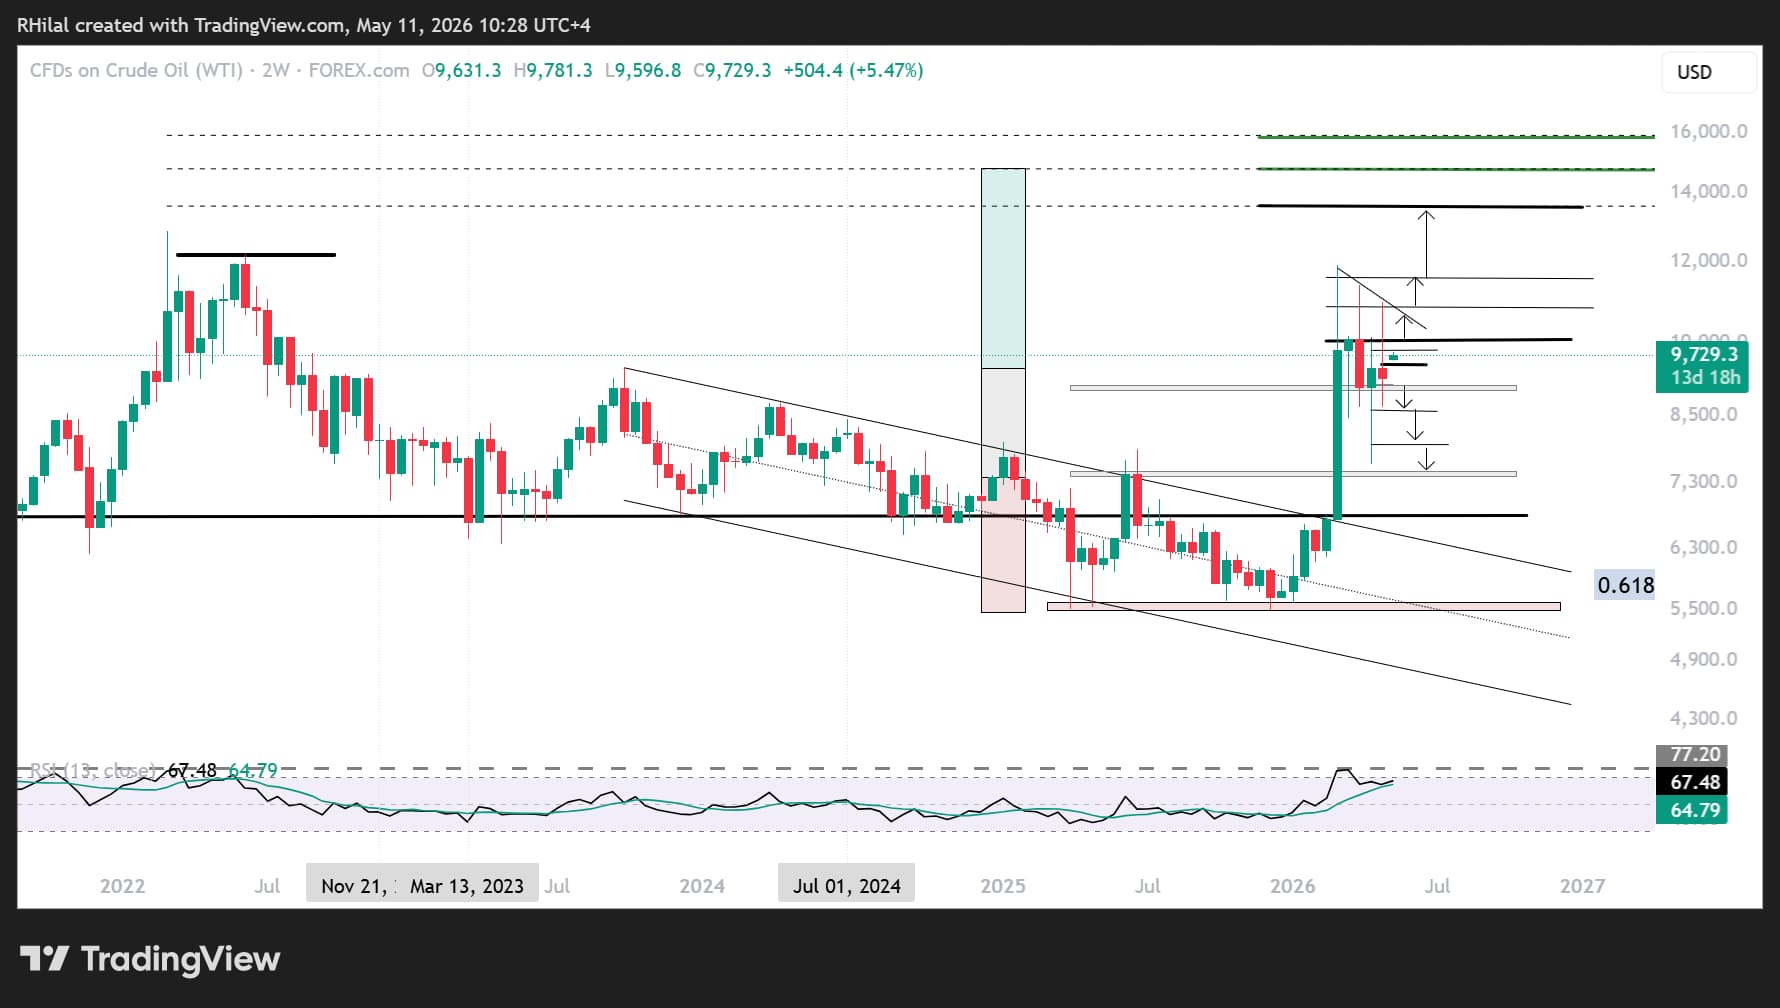
- Price action suggests bullish positioning above the 2023 highs, with key levels at $93 for WTI and $95 for Brent.
From a 2-week perspective, strong price rejections are visible below the $120 level, forming lower highs. At the same time, a strong bullish rejection from the $76 zone reinforces a broader structure of indecision with a bullish bias on the crude oil chart—until either diplomatic alignment or further geopolitical escalation materializes.
Crude Oil Price Forecast: 2-Week Chart Analysis (Log Scale)
 Source: Trading view
The following framework remains anchored in the Q2 2026 outlook, reinforcing the importance of long-term levels over political narratives on the price chart.
Scenario Framework:
- Bearish Scenario:
A diplomatic breakthrough, combined with a close below $91, $88, and $84, would expose prices to the previous rejection zone at $76–$74—the highs of June 2025 during prior Middle East tensions—testing the waters for a deeper crude unwind or another volatility-driven whipsaw. - Base Case:
Prolonged supply disruption keeps crude oil prices trading within the $91–$115 range. - Bullish Scenario:
Extreme geopolitical escalation could drive a sustained breakout above $115, extending toward $135 and $157, aligning with the 0.786 and 100% Fibonacci extensions of the 2020–2022–2026 price cycle.
Headline-driven volatility is one aspect of the market, but long-term price closes and sustained levels ultimately reveal the dominant trend and broader outlook for crude oil beyond short-term noise.
Written by Razan Hilal, CMT
Follow on X: @Rh_waves
Latest market news




The complete CFD trading experience
Award-winning platforms, competitive spreads, low commissions and dedicated support.
We live and breathe the markets and are dedicated to helping traders realise their ambitions as we continue to set the industry bar.
Economic calendar
Web Trader platform
Our sophisticated web-based platform is packed with features.
Related articles
Gold, silver outlook: Sandwiched between bullish bonds and AI angst
XAU/USD and XAG/USD may be approaching a bullish turning point as Treasury futures threaten a breakout. The problem? Both metals have recently been trading more like tech stocks than havens.
US Dollar, GBP/USD, USD/CAD, USD/CHF, Gold Weekly Technical Outlook 11 2 2026
Sr. Technical Strategist Michael Boutros highlights the levels that matter on the USD Majors, commodities, and equity indices charts this week.

US Midterm Forecast: The Key Risks for Traders to Watch Through the US Elections
Prediction markets are pricing in nearly 75% odds of a Democratic sweep in this week’s US midterm elections, a development that would result in a split from the single party Republican rule of the past two years - what will it mean for markets?

StoneX Europe Ltd may make third party material available on this website which may contain information included but not limited to the conditions of financial markets. The material is for information purposes only and does not contain, and should not be construed as containing, investment advice and/or investment recommendation and/or an investment research and/or an offer of or solicitation for any transactions in financial instruments; any decision to enter into a specific transaction shall be made by the client following an assessment by him/her of their situation.
StoneX Europe Ltd makes no representation or warranty and assumes no liability as to the accuracy or completeness of the information provided, nor any loss arising from any investment based on a recommendation, forecast or other information supplied. You should always seek independent advice as to your suitability to speculate in any related markets and your ability to assume the associated risks, if you are at all unsure. We are not under any obligation to update any such material. Any opinion made may be personal to the author and may not reflect the opinion of StoneX Europe Ltd.