





Daily Forex Technical Strategy Fri 06 Dec
Further potential USD weakness against GBP & EUR as NFP looms.
Share this:

EUR/USD – Potential push up to test major descending resistance
click to enlarge chart
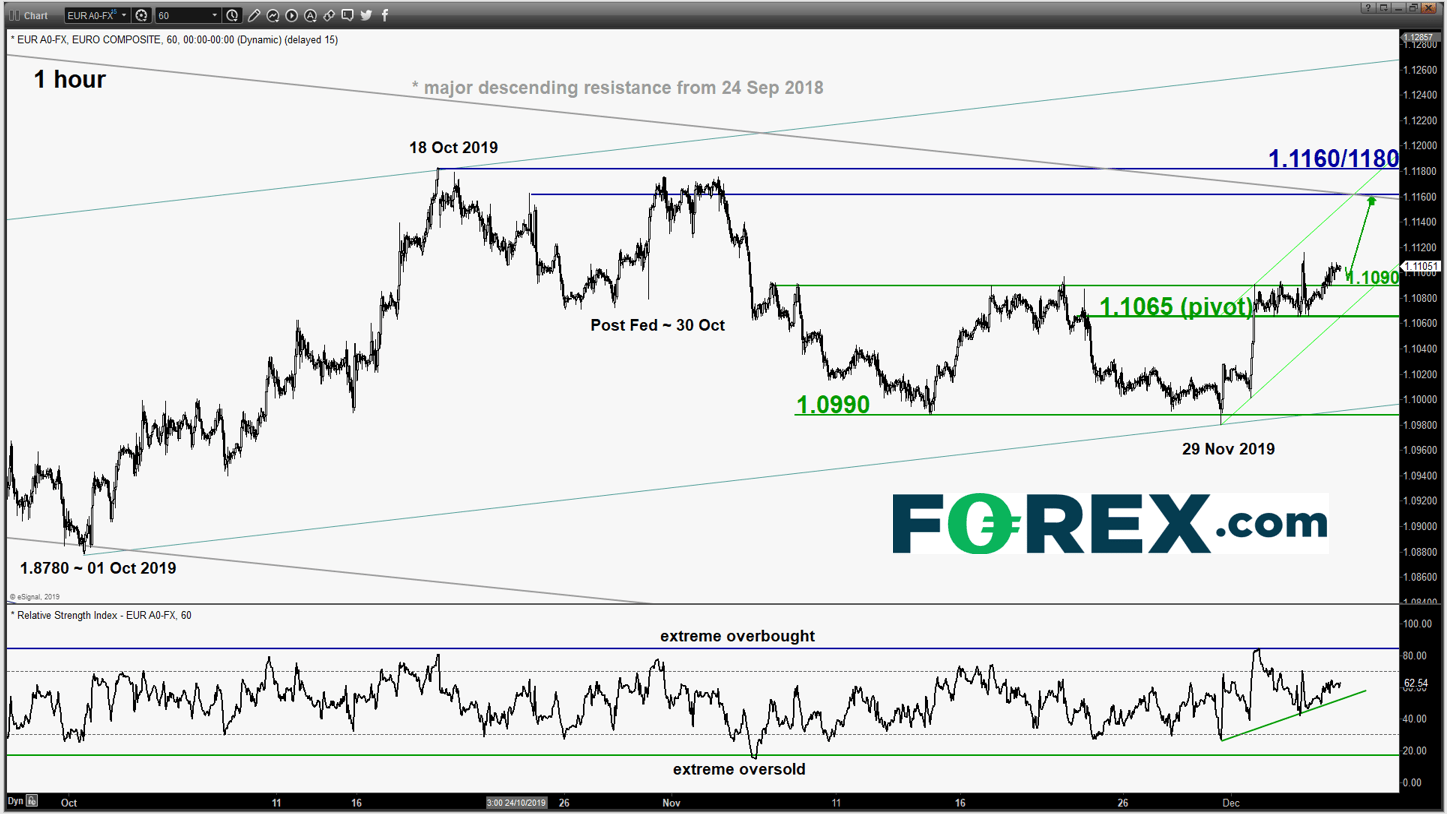
- The pair has staged a break above the 1.1090 upper limit of the short-term neutrality range as per highlighted in our previous report (click here for a recap). Right now, it may continue the push up to test the next resistance 1.1160/1180 (18 Oct 2019 range top & the major descending resistance from 24 Sep 2018) with 1.1065 as the key short-term pivotal support.
- However, a break with an hourly close below 1.1065 sees a slide back towards the minor range support of 1.0990.
GBP/USD – Bullish breakout but risk of a minor pull-back imminent
click to enlarge charts
- The pair has staged a bullish breakout above the 1.2970 range resistance and rallied by 190 pips in the last 3 days. In the medium-term, the impulsive up move sequence of the uptrend phase from 03 Sep 2019 low of 1.1959 has resumed.
- In the shorter-term, the hourly RSI oscillator has traced out a bearish divergence signal at overbought region which indicates that the on-going rally has reached at “overstretched” state where it may stage a pull-back.
- Flip to a bullish bias in any pull-back with 1.2970 as the key short-term pivotal support for another potential upleg to target the next resistances at 1.3200/3240 and 1.3300 next. However, an hourly close below 1.2970 negates the bullish tone for a deeper pull-back towards the next support at 1.2970/2950.
USD/JPY – Gyrating at the Ascending Wedge support
click to enlarge chart
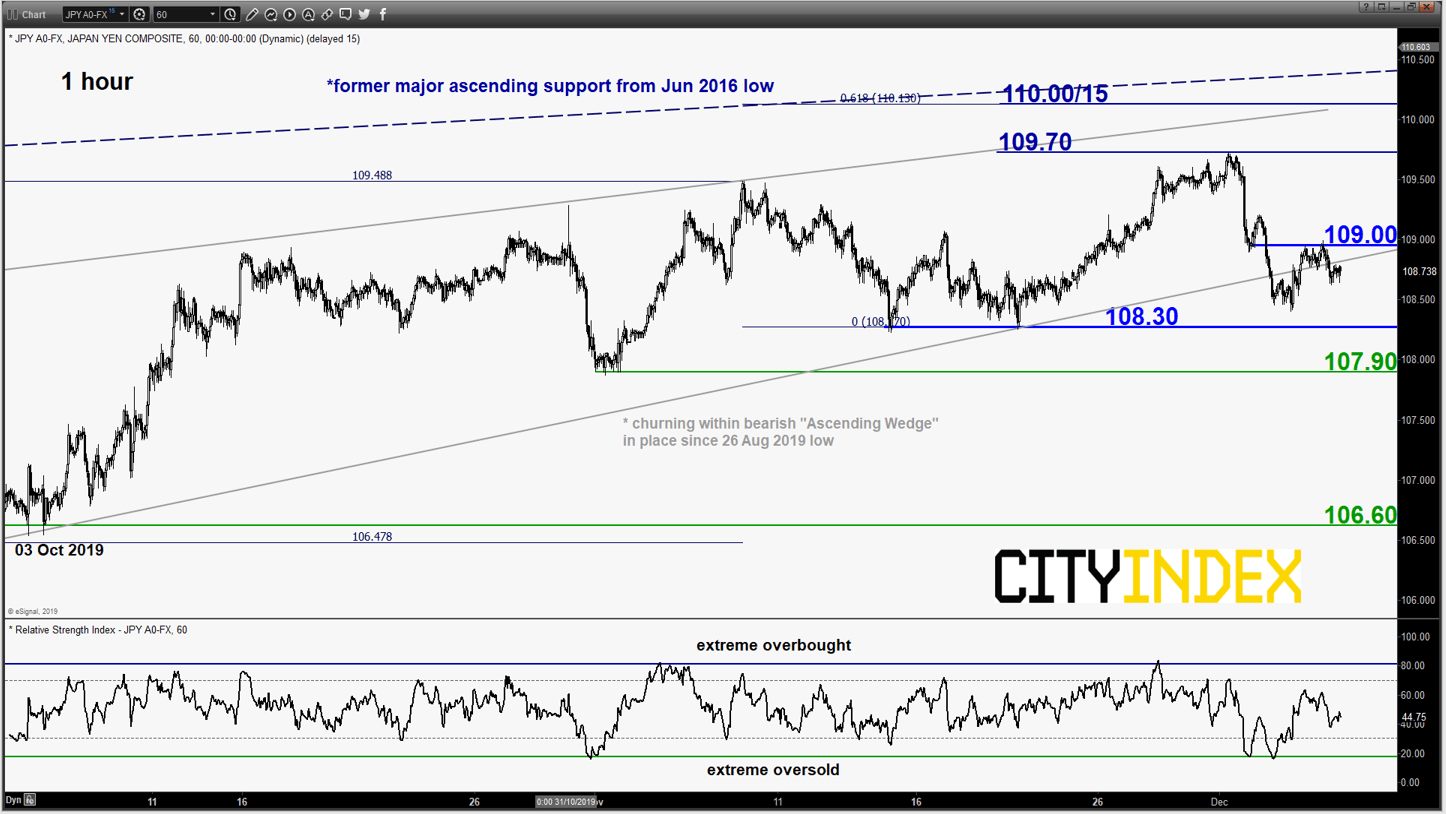
- The pair has whipsawed around the bearish “Ascending Wedge” support and conflicting U.S-China trade related news flow has made matter worse as we approach a “less liquid/thinly traded environment” towards the last 3 weeks of 2019.
- The conviction for a final push up towards the “Ascending Wedge” top/resistance at 110.00/15 as been reduced at this junction. Therefore, we prefer to turn neutral now between 109.00 and 108.30. Bears need to have an hourly close below 108.30 for a “clean break down” to target the next supports at 107.90 and 106.60 next.
- On the flipside, a clearance with an hourly close above 109.00 allows the short-term bulls to be in control for a push up towards 109.70 and 110.00/15 next.
AUD/USD – Sideways below major descending channel resistance for now
click to enlarge chart
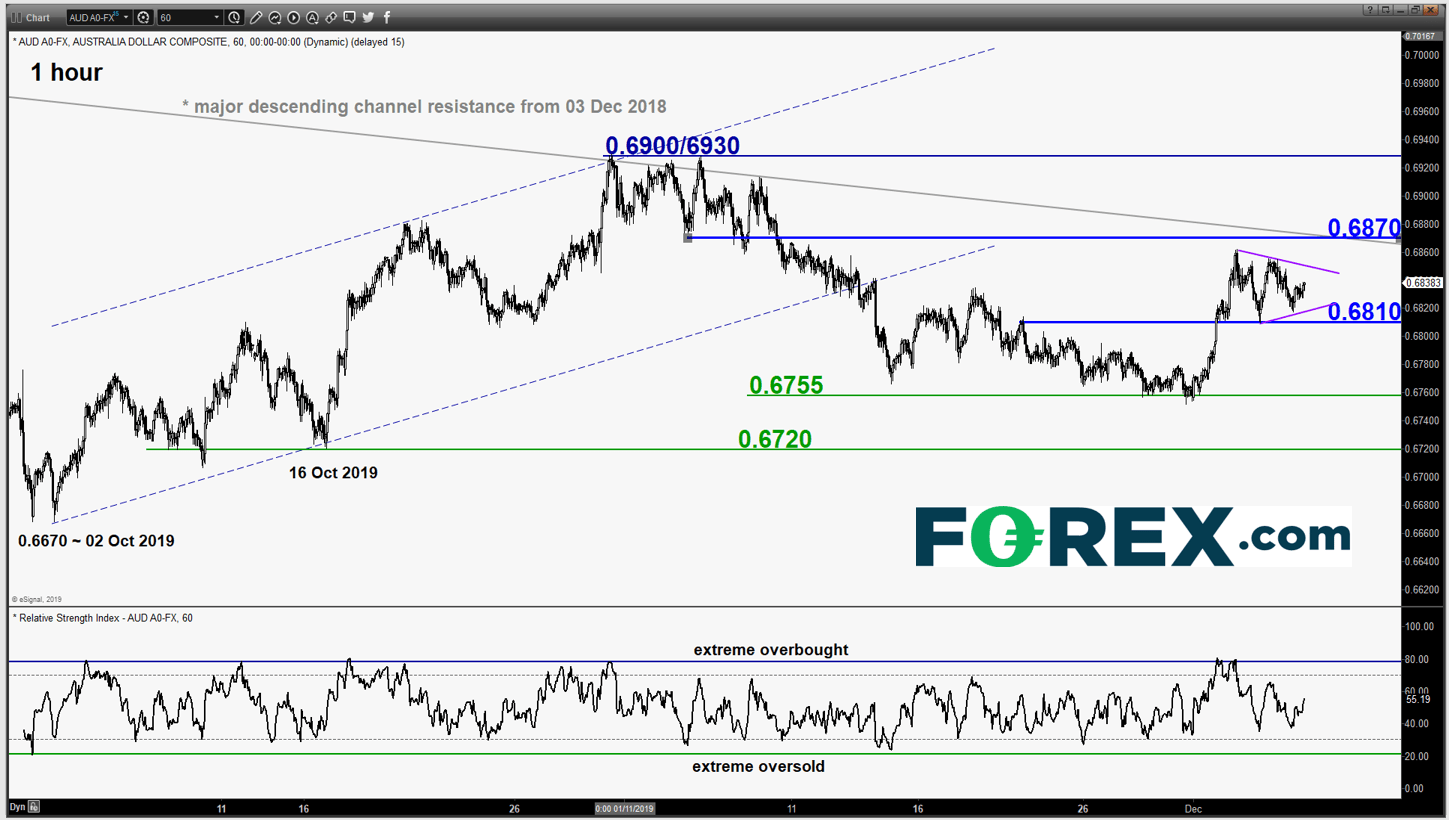
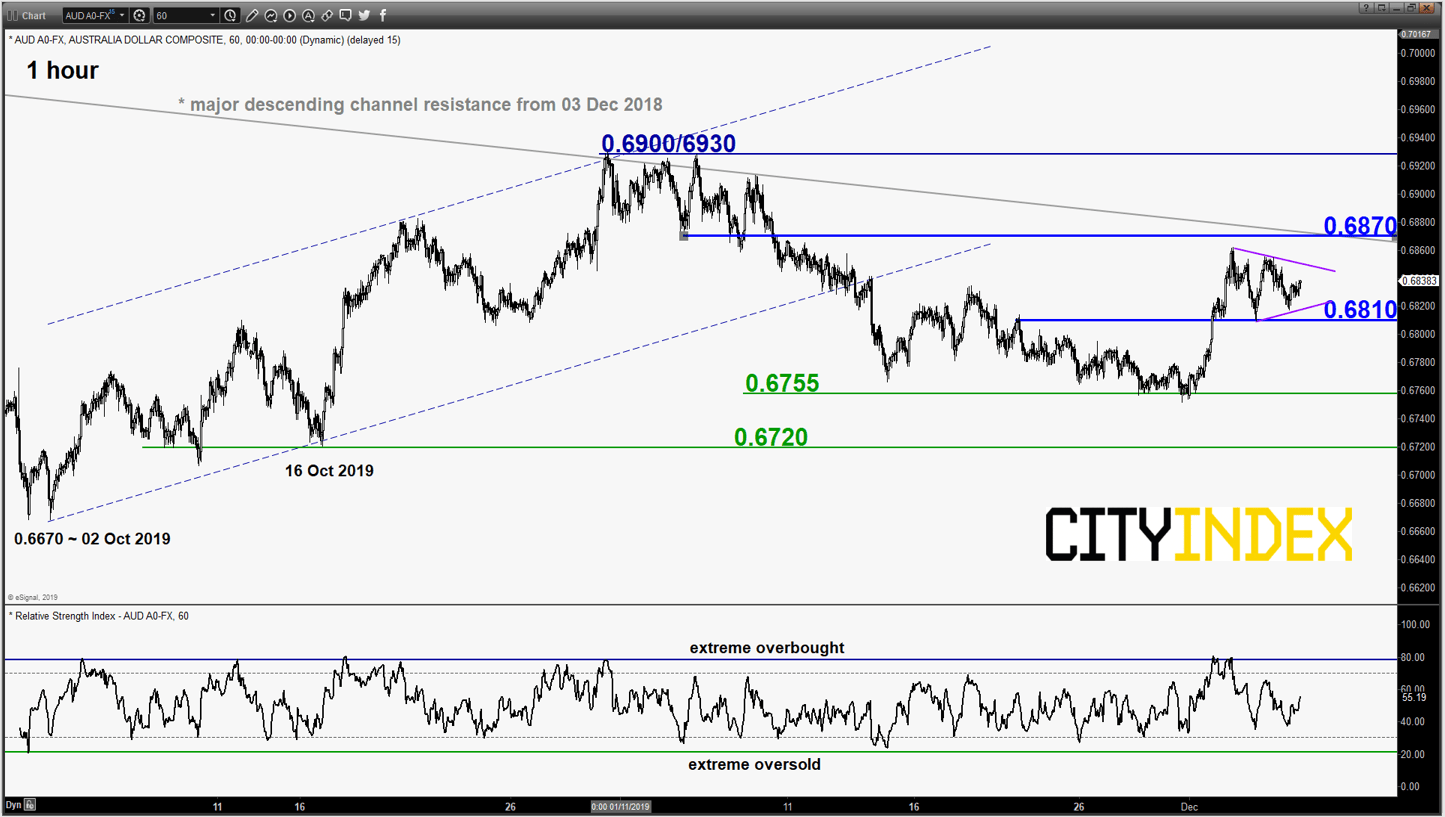
- After the recent RBA monetary policy meeting on 03 Dec, the pair has been trapped within a minor “Symmetrical Triangle” range configuration below the 0.6845 major descending channel resistance from 03 Dec 2018 high.
- Prefer to turn neutral now between 0.6870 (also the 61.8% Fibonacci retracement of the recent slide from 31 Oct high to 29 Nov 2019 low) and 0.6810. An hourly close below 0.6810 revives the short-term bearish tone for a slide to retest 0.6755 and even 0.6720 next.
- On the flipside, a clearance with a daily close above 0.6870 validates a major bullish breakout for an assault towards 0.6900/6930 in the first step.
Charts are from eSignal
EUR/USD – Potential push up to test major descending resistance
click to enlarge chart
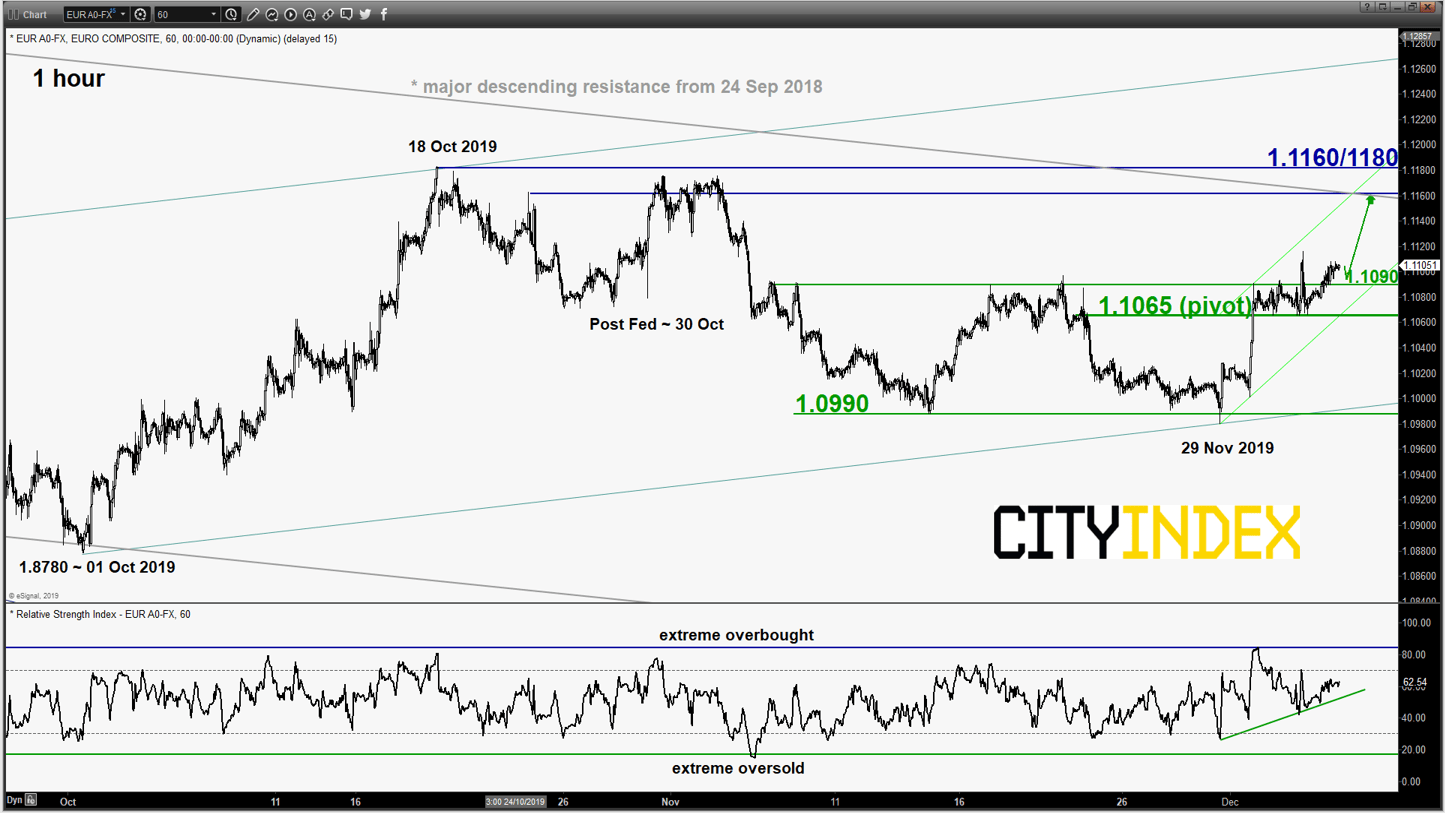
- The pair has staged a break above the 1.1090 upper limit of the short-term neutrality range as per highlighted in our previous report (click here for a recap). Right now, it may continue the push up to test the next resistance 1.1160/1180 (18 Oct 2019 range top & the major descending resistance from 24 Sep 2018) with 1.1065 as the key short-term pivotal support.
- However, a break with an hourly close below 1.1065 sees a slide back towards the minor range support of 1.0990.
GBP/USD – Bullish breakout but risk of a minor pull-back imminent
click to enlarge charts
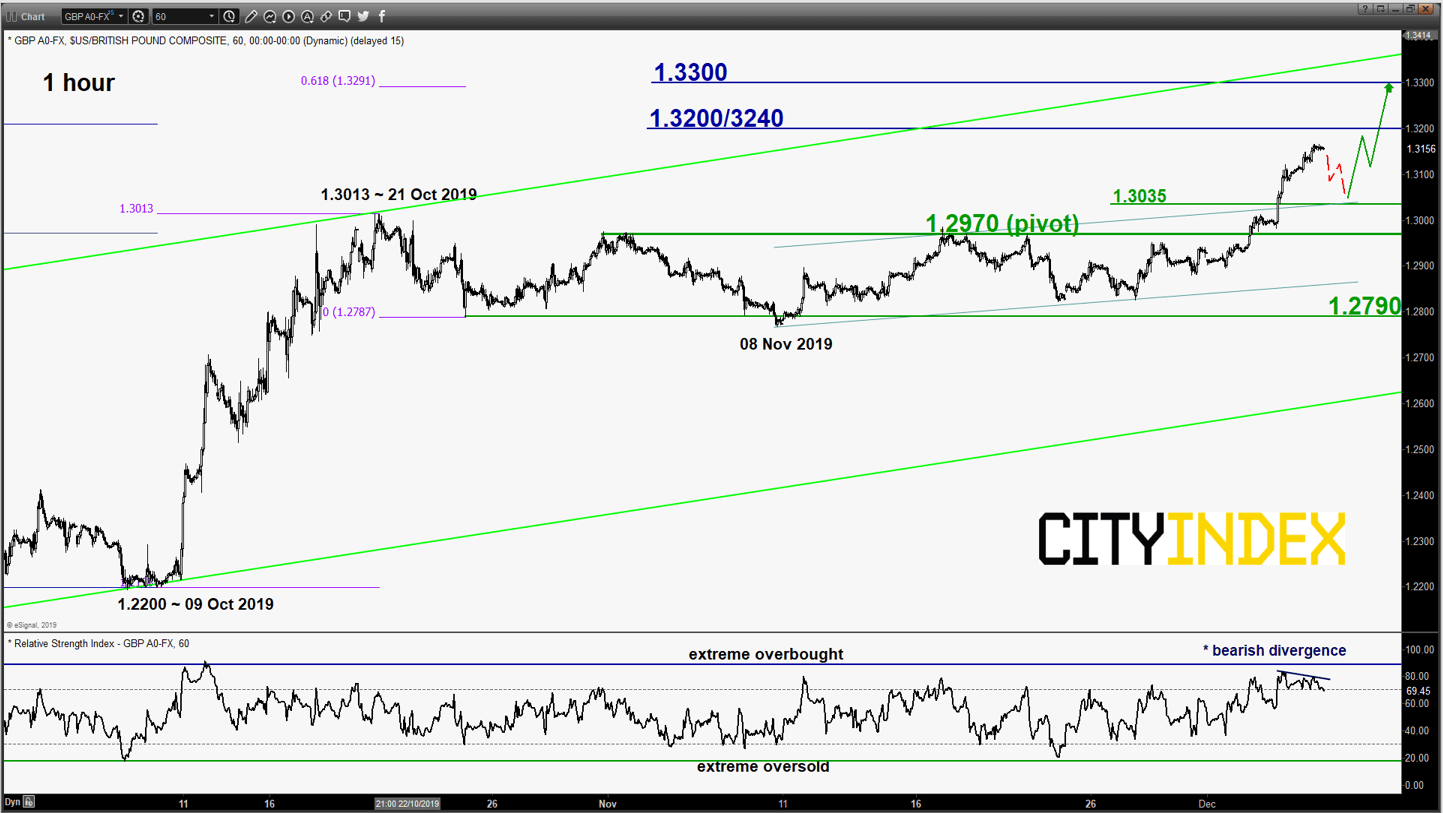
- The pair has staged a bullish breakout above the 1.2970 range resistance and rallied by 190 pips in the last 3 days. In the medium-term, the impulsive up move sequence of the uptrend phase from 03 Sep 2019 low of 1.1959 has resumed.
- In the shorter-term, the hourly RSI oscillator has traced out a bearish divergence signal at overbought region which indicates that the on-going rally has reached at “overstretched” state where it may stage a pull-back.
- Flip to a bullish bias in any pull-back with 1.2970 as the key short-term pivotal support for another potential upleg to target the next resistances at 1.3200/3240 and 1.3300 next. However, an hourly close below 1.2970 negates the bullish tone for a deeper pull-back towards the next support at 1.2970/2950.
USD/JPY – Gyrating at the Ascending Wedge support
click to enlarge chart
- The pair has whipsawed around the bearish “Ascending Wedge” support and conflicting U.S-China trade related news flow has made matter worse as we approach a “less liquid/thinly traded environment” towards the last 3 weeks of 2019.
- The conviction for a final push up towards the “Ascending Wedge” top/resistance at 110.00/15 as been reduced at this junction. Therefore, we prefer to turn neutral now between 109.00 and 108.30. Bears need to have an hourly close below 108.30 for a “clean break down” to target the next supports at 107.90 and 106.60 next.
- On the flipside, a clearance with an hourly close above 109.00 allows the short-term bulls to be in control for a push up towards 109.70 and 110.00/15 next.
AUD/USD – Sideways below major descending channel resistance for now
click to enlarge chart
- After the recent RBA monetary policy meeting on 03 Dec, the pair has been trapped within a minor “Symmetrical Triangle” range configuration below the 0.6845 major descending channel resistance from 03 Dec 2018 high.
- Prefer to turn neutral now between 0.6870 (also the 61.8% Fibonacci retracement of the recent slide from 31 Oct high to 29 Nov 2019 low) and 0.6810. An hourly close below 0.6810 revives the short-term bearish tone for a slide to retest 0.6755 and even 0.6720 next.
- On the flipside, a clearance with a daily close above 0.6870 validates a major bullish breakout for an assault towards 0.6900/6930 in the first step.
Charts are from eSignal
Latest market news



The complete CFD trading experience
Award-winning platforms, competitive spreads, low commissions and dedicated support.
We live and breathe the markets and are dedicated to helping traders realise their ambitions as we continue to set the industry bar.
Economic calendar
Web Trader platform
Our sophisticated web-based platform is packed with features.
Related articles
EUR/USD Q4 2026 Outlook: Euro at a Crossroads as Fed, ECB Tighten 9 25 2026
EUR/USD enters Q4 at a pivotal inflection point as competing Fed-ECB policy paths and persistent inflation risks collide with major technical support.


USD/JPY Q4 2026 Outlook: Hawkish Fed Pricing Clashes With Intervention Risk
The year-end tug-of-war is clear: hawkish Fed pricing supports USD/JPY, while intervention risk limits the upside.


Japanese Yen Forecast: USD/JPY 4% Rally Challenges Post-Intervention Downtrend 9 24 2026
USD/JPY momentum has shifted sharply higher, putting a major resistance confluence in focus as U.S. and Japanese event risk builds.
StoneX Europe Ltd may make third party material available on this website which may contain information included but not limited to the conditions of financial markets. The material is for information purposes only and does not contain, and should not be construed as containing, investment advice and/or investment recommendation and/or an investment research and/or an offer of or solicitation for any transactions in financial instruments; any decision to enter into a specific transaction shall be made by the client following an assessment by him/her of their situation.
StoneX Europe Ltd makes no representation or warranty and assumes no liability as to the accuracy or completeness of the information provided, nor any loss arising from any investment based on a recommendation, forecast or other information supplied. You should always seek independent advice as to your suitability to speculate in any related markets and your ability to assume the associated risks, if you are at all unsure. We are not under any obligation to update any such material. Any opinion made may be personal to the author and may not reflect the opinion of StoneX Europe Ltd.